Download
1 / 19
190 likes | 363 Views
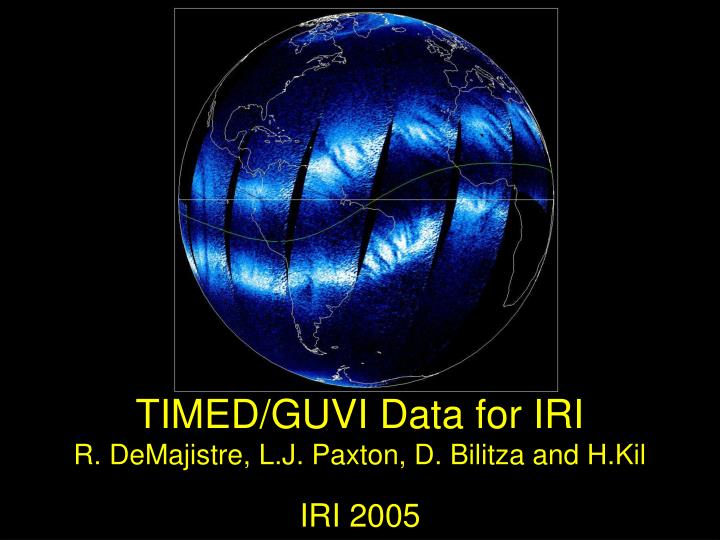
TIMED/GUVI Data for IRI R. DeMajistre, L.J. Paxton, D. Bilitza and H.Kil. IRI 2005. GUVI for the ionosphere. What is TIMED/GUVI Measurement methods for the nighttime ionosphere Ionosonde validation Application – Calibration transfer GUVI and IRI.

E N D
TIMED/GUVI Data for IRIR. DeMajistre, L.J. Paxton, D. Bilitza and H.Kil IRI 2005
GUVI for the ionosphere • What is TIMED/GUVI • Measurement methods for the nighttime ionosphere • Ionosonde validation • Application – Calibration transfer • GUVI and IRI Motivation for future work and collaboration rather than final results
GUVI - Global UV Imager • Scanning Spectrographic Imager • Covers 115-180 nm in 160 nm spectral bins • 14 cross track spatial pixels act as a linear array • TIMED Spacecraft • High inclination circular orbit, ~625 km altitude • Covers all local times in 60 days • Nightside passes ~25 degrees apart
O+ + e O + hn at night Dayside radiance Dark at night Dark at night Dark at night Nightside measurements • GUVI ‘colors’ summed on board – 5 bright FUV spectral features • Only 2 colors are usually detected at night • Color 3, 135.6 nm, due almost entirely from F region recombination GUVI Colors
GUVI F Layer Disk Measurements • GUVI down-looking pixels yield slant column brightness through the F Layer • Can be converted to TEC with some assumptions about profile shape • Very high spatial resolution (~ 25x25 km) reveals bubbles and irregularities Composite 135.6 nm image for day 82, 2002
Limb Measurements • First 32 steps of each scan are on the limb (100 – 520 km) • Constrained linear inversion yields volume emission rate/electron densities Systematic monitoring of the nighttime F Region
Monitoring the Ionosphere Coverage • Altitude – Each scan, 150 – 500 km • Latitude – Each orbit • Longitude – Each day • Local time – 60 days • Over 3 years of data yields seasonal coverage as well Limits • Low signal levels away from the anomalies • Assumption of spherical symmetry • Recombination rate is uncertain • Assumes one constituent ionosphere (O+)
Global Observations • Electron densities can be used to estimate NMF2 • Coverage allows global maps • Orbit precession rate allows inter-annual comparisons • Can be compared directly with ionosonde data or IRI
Ionosonde Comparisons • GUVI electron density profile fit with a Chapman layer • NMF2 and HMF2 taken directly from the fit • Same process can be used with IRI
Ionosonde Data • Ionosonde Data Supplied to from the various stations • Data from other stations was supplied but had no suitable GUVI coincident measurement
GUVI Selections Criteria for selecting coincidences • Within 200 km and 20 minutes • Chapman layer fit successful • Good fit to data • Realistic HMF2 and NMF2 • No ‘qualifying letters’ on ionosonde data 427of 1112 observations met these criteria
GUVI and IRI have similar spread (~30-40%) • GUVI compares well between 0.5 and 1.0 (106 cm-3) • IRI bias similar in shape to GUVI • Both GUVI and IRI show ‘discontinuity’ at 1.0 (106 cm-3)
IRI/GUVI comparison • Similar spread as (~30%) • At higher NMF2, GUVI systematically low • Slope of bias is constant (suggests calibration of GUVI is reasonable)
Conclusion of comparisons • At moderate NMF2, GUVI predicts ionosonde measurements with 30% or so • In the same range, IRI behaves the same way with a fairly large positive bias • At larger NMF2 both under-predict
Calibration Transfer • The issue – Ionosonde intercalibration • Various instrument designs • Separate calibrations • Independently operated • Example solution – Ozone monitors • ‘Standard instrument’ carried from site to site • Makes simultaneous measurements • Suggested approach – Orbiting UV monitoring • Use GUVI (and/or its successors) to transfer calibration
Inter-ionosonde Comparisons • Significant differences between stations • Significant regional differences • GUVI statistics can be used to identify areas that may need attention • In principle, GUVI measurements should have little geographic dependence • Geographic differences in profile shapes and horizontal gradients may have some influence
GUVI and IRI - Conclusions • GUVI can provide systematic observations • Can be used to compare with IRI • Once differences are understood, observations can be included in IRI • GUVI can be used to refine ionosonde measurements • Provide better IRI validation • Provide better IRI input