Download
1 / 56
560 likes | 779 Views
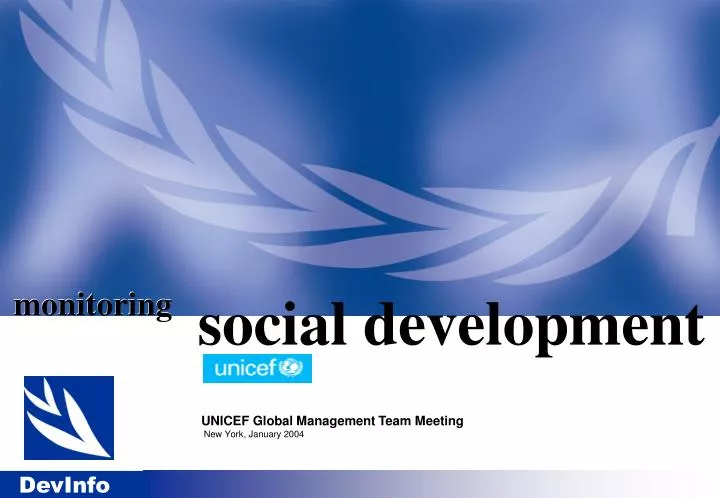
monitoring. monitoring. social development. UNICEF Global Management Team Meeting New York, January 2004. All data compiled in one system. Easy retrieval of data. Analysis of trends over time. Multiple sources of data. Strengthen national monitoring. Data. Objectives.

E N D
monitoring monitoring social development UNICEF Global Management Team Meeting New York, January 2004
All data compiled in one system Easy retrieval of data Analysis of trends over time Multiple sources of data Strengthen national monitoring Data Objectives Database System Functions INDICATORS Database
8 development goals 11 related targets 48 indicators 25 years: 1990 to 2015 Millennium Declaration Millennium Development Goals
Global & user-defined goals Global & user-defined indicators Easily adapted to country specs Easy to share databases Ten levels of geography Geography linked to maps Integrated with MS Office Technical support team DevInfo Database System User-Friendly Database on Human Development
DevInfo Database System Home Page
DevInfo Database System Indicators by Goals
DevInfo Database System Time Periods
DevInfo Database System Geographic Areas
DevInfo Database System Data View
DevInfo Database System Data Presentations
User-defined rows & columns Presentations Tables
User-defined X axis & Y axis Presentations Graphs
Thematic map Presentations Maps
Presentations saved in gallery Presentations Gallery
EXAMPLES Zooming In on Key Indicators South Asia
Regional South Asia Nepal
National Nepal Regions
Sub-National Eco-Development Zones
Districts Eastern Terai Eco-Zone Morang
Sub-Districts Morang VDC
Monitoring at Subnational Level Human Development
Human Development Index Monitoring at Subnational Level Human Development 1996
Human Development Index Monitoring at Subnational Level Human Development 2000
Human Poverty Index Monitoring at Subnational Level Human Poverty 1996
Human Poverty Index Monitoring at Subnational Level Human Poverty 2000
Monitoring Exposure to Disasters Natural Disasters Gujarat
Monitoring Exposure to Disasters Natural Disasters Gujarat
Monitoring Exposure to Disasters Natural Disasters Gujarat
Apr 2001 Population Movements Monitoring Population Movements Internally Displaced Persons Angola
June 2000 Monitoring Accessibility UNICEF Angola: NID Against Polio Angola
July 2001 Monitoring Accessibility UNICEF Angola: NID Against Polio Angola
Monitoring the Situation of Children Malnutrition
40% 35 30 25 20 15 1990 1991 1992 1993 1994 1995 1996 1997 1998 1999 2000 UNDERWEIGHT 1990-2000 TRENDS MOZAMBIQUE MALAWI SWAZILAND ZAMBIA LESOTHO ZIMBABWE
ZAMBIA 541 000 MALAWI 532 000 MOZAMBIQUE 702 000 ZIMBABWE 496 000 LESOTHO 46 000 SWAZILAND 14 000 UNDERWEIGHT 2001-2002 HOW MANY? 30% 2.3 MILLION CHILDREN 20 10 0
WASTING ZAMBIA UNDERWEIGHT 2001
TRENDS 1999-2003 42 40 38 36 34 32 30 28 26 24 22 20 18 1999 2003 ZAMBIA UNDERWEIGHT 2001 MONZE SIAVONGA SINAZONGWE KALOMO
Composite index calculate wizard User-defined indicators Indicators by weight National, sub-national data Assessing Humanitarian Need Ranking by Composite Index
Assessing Humanitarian Need Early Childhood Care Index
ESARO Tanzania: Early Childhood Care • Births attended by trained personnel 1
ESARO Tanzania: Early Childhood Care • Births attended by trained personnel • Low birth weight 2
ESARO Tanzania: Early Childhood Care • Births attended by trained personnel • Low birth weight • Underweight 3
ESARO Tanzania: Early Childhood Care • Births attended by trained personnel • Low birth weight • Underweight • Diarrhoea cases 4
ESARO Tanzania: Early Childhood Care • Births attended by trained personnel • Low birth weight • Underweight • Diarrhoea cases • DPT immunization 5
5 ESARO Tanzania: Early Childhood Care Highest Kilimanjaro 0.79 D’Salaam 0.70 Lowest Iringa 0.38 Kigoma 0.36
ESARO Tanzania: Early Childhood Care • Composite Index
National Databases Adaptations
National Databases Adaptations
National Databases Adaptations
National Databases Adaptations