Download
1 / 20
200 likes | 307 Views
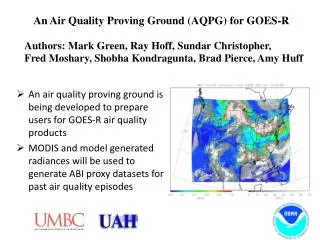
Development of a Simulated Synthetic Natural Color ABI Product for GOES-R AQPG . Hai Zhang UMBC 1/12/2012 GOES-R AQPG workshop. Outline. Overview of the problem and our solution The method used in AQPG 2011 summer demo Further improvement of the method.

E N D
Development of a Simulated Synthetic Natural Color ABI Product for GOES-R AQPG Hai Zhang UMBC 1/12/2012 GOES-R AQPG workshop
Outline • Overview of the problem and our solution • The method used in AQPG 2011 summer demo • Further improvement of the method
The problem for GOES-R natural color image generation • We need red, green, blue reflectance to generate natural color image • MODIS has the three channels so that it is easy for us to generate natural color images from MODIS data • GOES-R does not have a green channel • Following is a list of GOES-R visible and NIR/SWIR channels and the corresponding MODIS channels
Our solution • Use MODIS data to find the relationship of reflectance in green channel to the other channels • The relationship can be different for different types of surface, atmospheric condition, and different for different seasons, sun-satellite geometry … • Land • Ocean • Cloud • Aerosol • Apply the relationship on GOES-R data to derive green reflectance from the channels available
Land surface reflectance generation • Land surface reflectance varies for different satellite-sun geometry. Such variation can be modeled by BRDF (bidirectional reflection distribution function) • MODIS land surface BRDF product • The product is derived using 16 days of MODIS data and updated every 8 days • The 6 channels corresponding to GOES-R visible/NIR/SWIR channels and the green channel • With BRDF data, we can calculate land surface reflectance in any sun-satellite geometry • For the summer 2011 demo, the satellite is assumed to be located at 75°W above equator, which is the position of GOES-East.
Surface reflectance vs. Sun-satellite geometry for GOES – an example • Satellite angles are fixed, solar angles change during a day • A selected pixel in the eastern US: Satellite is fixed Sun moves θs : Solar zenith angle, changes θv: Satellite zenith angle, fixed φs- φv :Relative azimuth angle, changes
Scatter plots between green and GOES-R bands on land surface southeastern US area (summer 2011 demo) The red channel has the best correlation with the green channel: 0.9
Natural color generation land for land surface (summer 2011 demo) MODIS RGB land surface Land surface using derived green Red=MODIS red Green= 0.69*red+0.04 Blue=MODIS blue
Ocean surface • Use a Rayleigh corrected MODIS scene to get relation on ocean surface
Algorithm flow chart for summer 2011 demo Income GOES-R TOA reflectance proxy data Rayleigh correction Land surface? Natural color image generation No Green=red×1.07+0.01 Yes Derived green Green=red×0.69+0.04 Output image
An example of natural color image animation from GOES-R proxy data (2011-7-26)
Explanation of image blurriness in the early morning and in the late afternoon noon • TOA reflectance observed from satellite contains contribution from the surface and the atmosphere • The atmosphere contains aerosols even in clear days • In the early morning and late afternoon, solar zenith angle is large and hence the light • passes through more air mass or aerosolsthan at the noon. Early morning or late afternoon Short path through atmosphere Long path through atmosphere surface AOD=0.1 AOD=0.0 Atmosphere contribution Surface contribution
Further improvement • The regression between red and green can be different • Different surface type • Different season • Different time during a day • Add blue channel • Can we improve? • Cloud and aerosol
Improvement #1: Land surface over US • Use MODIS BRDF to calculate surface reflectance at GOES-East geometry • Divide surface into 1°× 1° area • Investigate the linear regression relation between red and green for each area, season and time in a day • Build look-up-table (LUT) • Slope, intercept for each area, day in a year, time of a day • Use the LUT and input red signal to derive green
Seasonal change – correlation coefficient Mostly above 0.9 winter spring 0.0 0.5 1.0 0.0 0.5 1.0 0.0 0.5 1.0 summer fall 0.0 0.5 1.0 0.0 0.5 1.0
Improvement #2: Add reflectance in blue channel • Assume the relation to be: green=A1×red+A2×blue+B • Repeat the same procedure as for red to build LUT • LUT include two slopes (A1 and A2) and one intercept (B) for different area, season, time of the day
Comparison of the original and two improvements • Only apply the relation to surface reflectance in red less than 0.3 • The comparison is over the whole US on day 137 green=0.69*red+0.04 Usered LUT Usered and blue LUT
True color Green=0.69*red+0.04 Natural color using derived green from LUT withred and blue channel Natural color using derived green from LUT with red channel
Algorithm flow chart for improved method Income GOES-R TOA reflectance proxy data Rayleigh correction No No Land surface? Cloud with reflectance > 0.3? Green=red×1.07+0.01 Yes Yes Green=redx0.96+0.02 Derive green from LUT Derived green Natural color image generation Output image
Summary • Green reflectance can be derived from red and blue channels • The relationships are verified by analyzing MODIS RGB images and data • In summer 2011 demo, we use a fixed relationship to derive green reflectance from red • We improved the method: • Over land surface, we build LUT based on MODIS BRDF • Over ocean and clouds, we use fixed relation with red