Download
1 / 12
120 likes | 132 Views
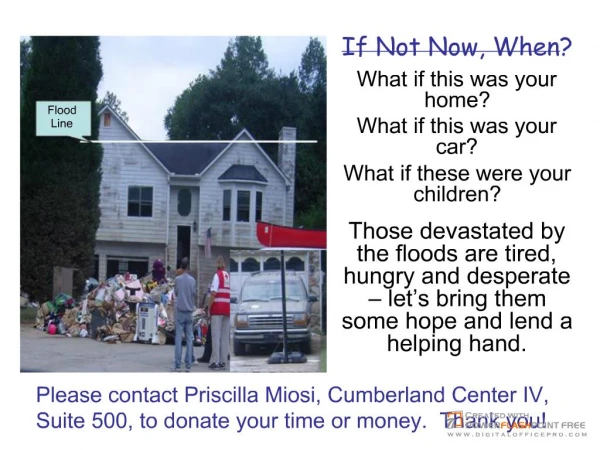
This analysis examines the extent of wetland loss and residential growth on the east shore of the Great Salt Lake, focusing on the impact on flood risk. The study reveals an increase in residential areas prone to flooding and a significant decrease in wetlands in some areas.

E N D
Wetlands Loss, Development and Flood Risk on the east shore of the Great Salt Lake Becka Downard November 29, 2007
Objective • To analyze the extent of wetland loss and residential growth on the east shore of the Great Salt Lake in relation to flood risk.
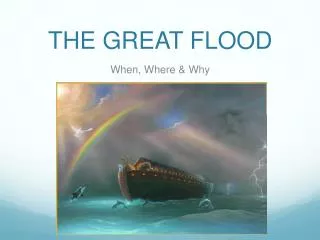
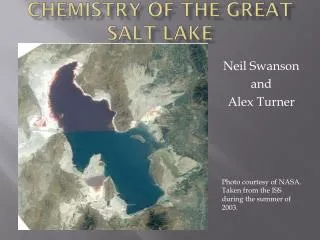
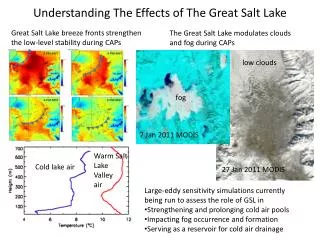
The Great Salt Lake • Shallow body of water • Small change in water elevation makes a large change in area • Fed mainly by snow melt • After years of drought, the lake elevation is currently 1,279 m; • Maximum elevation is 1,284 m.
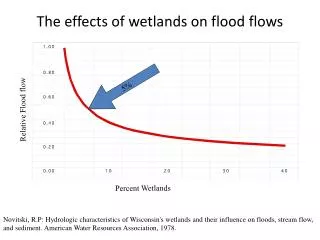
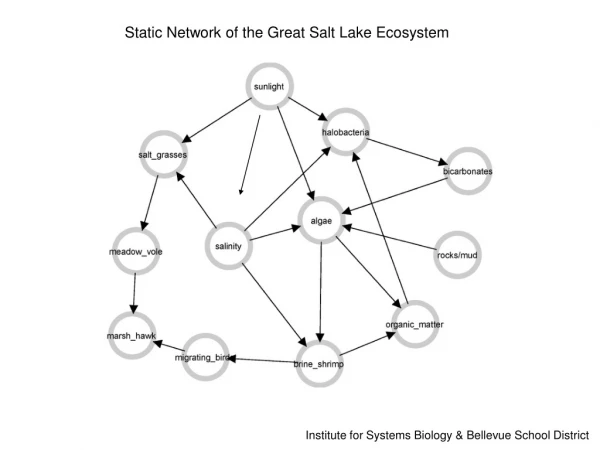
Wetlands • Help buffer floods • Protected ecosystem • Declining in some areas, increasing in others
Land Cover Assessment • Compared changes in wetland and low/high residential area between 1992 and 2001
1992 2001
1992 • Compared land cover classes with lake boundaries from different years • Delineating the area between 1,283 and 1,286 m included two areas of residential land cover
2001 Larger areas of high and low intensity residential areas within former lake boundary
1992 2001 Wetland Area (estimated) 2,698.58 km2 62.06 km2 Industry/Residential in flood boundary 14.21 km2 22.87 km2 What I Found • High and low intensity residential areas have increased since 1992, and come into areas that are prone to flooding • Wetlands have decreased significantly in Davis and Salt Lake Counties
Fluctuations in GSL elevation with percent of normal snowpack 215% (1983) 116% (1992) 162% (2001)
What’s Next • More accurate estimate of wetland loss/residential gain • More recent data to check for continuing trends • Find a consistent estimate for lake elevation (min and max)
Data Sources • USGS Seamless Distribution • EPA Multi-Resolution Land Characteristics Consortium (MRLC) • Utah AGRC • USGS Great Salt Lake Webpage • Great Salt Lake Basin Hydrologic Observatory