Download

1 / 7
70 likes | 161 Views
7.6 Solving Systems of Linear Inequalities. Remember How to Sketch the graph of 6x + 5y ≥ 30…. Write in slope- intercept form and graph: y ≥ - 6 / 5 x + 6 This will be a solid line. Test a point. (0,0) 6(0) + 5(0) ≥ 30 0 ≥ 30 Not a solution. Shade the side that doesn’t include (0,0).

E N D
Remember How to Sketch the graph of 6x + 5y ≥ 30… • Write in slope- intercept form and graph: • y ≥ -6/5x + 6 • This will be a solid line. • Test a point. (0,0)6(0) + 5(0) ≥ 300 ≥ 30 Not a solution. • Shade the side that doesn’t include (0,0). 6 4 2 -6 -4 -2 2 4 6 8 -2 -4 -6
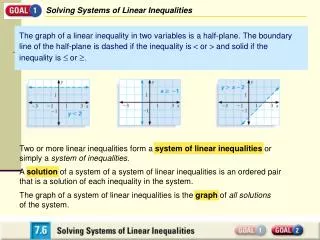
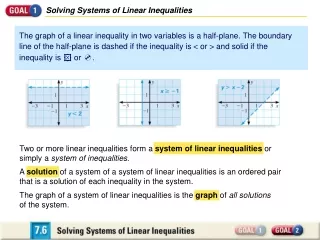
With a linear system, you will be shading 2 or more inequalities. Where they cross is the solution to ALL inequalities.
y < 2 x > -1 y > x-2 For example… The solution is the intersection of all three inequalities. So (0,0) is a solution but (0,3) is not.
Steps to Graphing Systems of Linear Inequalities • Sketch the line that corresponds to each inequality. • Lightly shade the half plane that is the graph of each linear inequality. (Colored pencils may help you distinguish the different half planes.) • The graph of the system is the intersection of the shaded half planes. (If you used colored pencils, it is the region that has been shaded with EVERY color.)
y < -2x + 2 y < x + 3 y > -x - 1 Practice…
y < 4 y > 1 Practice…