Download
1 / 28
320 likes | 882 Views
APPLICATION OF LIDAR IN FLOODPLAIN MAPPING. Imane MRINI GIS in Water Resources University of Texas at Austin. Source. Optech,Inc. PURPOSE OF THIS PROJECT. Show how LIDAR technology can be used jointly with

E N D
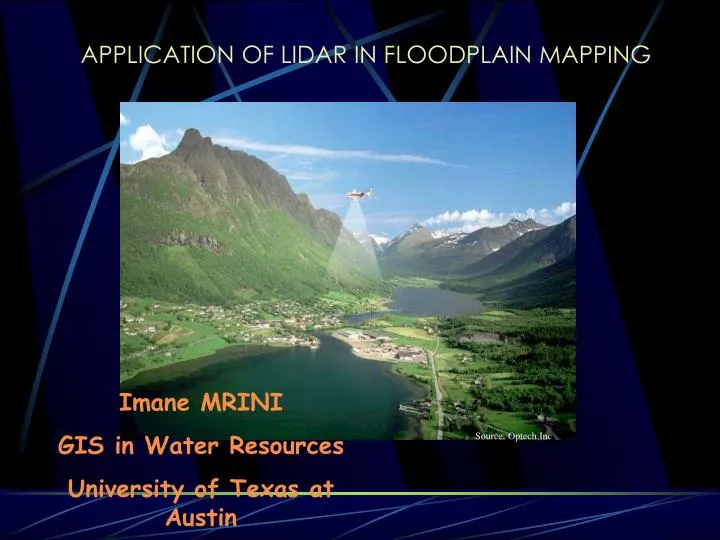
APPLICATION OF LIDAR IN FLOODPLAIN MAPPING Imane MRINI GIS in Water Resources University of Texas at Austin Source. Optech,Inc
PURPOSE OF THIS PROJECT Show how LIDAR technology can be used jointly with GIS and hydraulic models to map the possible extent of flooding, and to prove that it could be an invaluable tool in flood mapping because of its high accuracy.
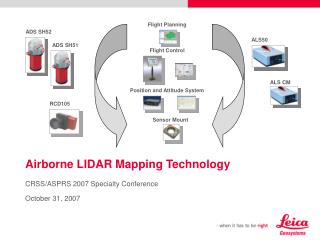
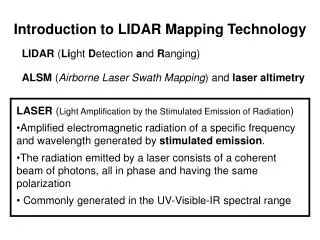
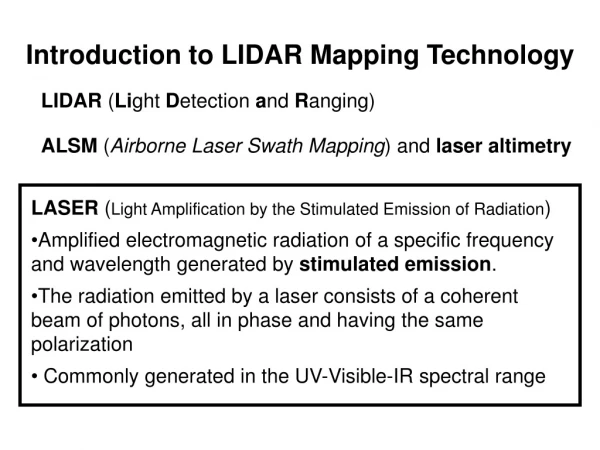
WHAT IS LIDAR ? Acronym for LightDetection AndRanging • Airborne laser system used to acquire x, y, and z coordinates of terrain, and consist of : • Airborne Global Positioning System (GPS) • Attendant GPS base station • Inertial Measuring Unit (IMU) • Light-emitting scanning laser.
HOW LIDAR WORKS • Laser pulse rate: up to 25,000 per sec. • Operating altitude: 400 - 2,000 meters. • Swath width: up to 1,500 meters • at 2,000 meter altitude.
PRECISION OF THE LIDAR DEM Source.BEG
LIDAR INSTRUMENT All-Terrain Laser Mapper (ALTM)
LIDAR FACTS • Elevation accuracy : 10 to 25 cm • records first and last returns of individual pulses and intensity Applications in : Flood mapping Forest management Coastal management Land cover classification Atmospheric pollution monitoring
DATA PROCESSING Source : BEG • compute a differentially corrected aircraft trajectory using a GPS software, • generate the raw x, y, and z data, • grid the data to generate an “all-points DEM”, (4) filter the raw data and re-grid to generate a “vegetation-removed DEM”
EFFECT OF VEGETATION REMOVAL After Before
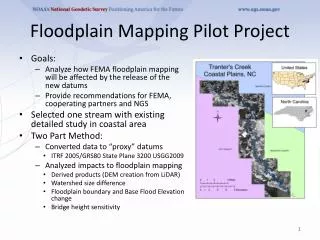
FLOODPLAIN MODELING • Study area : Waller creek watershed in Austin,TX • LIDAR data source : Bureau of Economic Geology- University of Texas at Austin • Type of Lidar data : 1m DEMs of the all-point and bare-earth data as interchange files ( e.00) • Spatial reference : UTM zone 14, datum NAD 1983 • Softwares used : ArcGis ( Arctoolbox, ArcMap),Arcview , HEC-RAS+HecGeoRas extension
STUDY AREA Waller Creek Watershed
HEC-RAS steady state simulation FLOOD MODELING PROCEDURE HEC-GeoRas Preprocessing Geometric data stream centerlines, riverbanks, floodplain boundaries, cross-sections along the streams ARCVIEW Terrain model processing Flood map visualization Hydraulic modeling HEC-GeoRas Postprocessing Import file LIDAR input data 1m grid DEM Hydrologic modeling Plan data ( Flow regime) Flow data from HEC-HMS
Extracting geometric data • Use of Spatial Analyst ,3D Analyst and Hec-GeoRas extensions • Using HEC-GeoRas extension and the digitizing tool in Arcview, I generated : - Streamcenterlines - Stream banks - Flow path centerlines - Cross section lines
DIFFICULTY ENCOUNTERED Problem : Hec-GeoRas program only works with TINs Solution : Convert grids to TINs in ArcMap using the best vertical accuracy to generate the maximum number of triangles in a reasonable amount of time
DIFFICULTY ENCOUNTERED AT THIS STAGE An error message from the Hec-PreRAS program during the import file process.
WORK TO BE DONE : MODELING WITH HEC-RAS • Cross-section extracted • from the TIN. • RAS stream geometry. • Resulting water • elevations.
PREVIOUS FLOOD MAPPING WITH TINs (Source. Esteban Azagra)
Future work • Solving the problem of the HecRas import file, hopefully before December 6 • Potential ideas to develop: - Write a program that incorporate grid data in the preprocessing for HEC-RAS • Obtain a more detailed TINs from the grid conversion
ACKNOWLEDGMENT • Dr. David Maidment, University of texas at Austin • Becky Smith, Bureau of Economic Geology, University of Texas at Austin • John Andrews, Bureau of Economic Geology, University of Texas at Austin