Download
1 / 41
410 likes | 566 Views
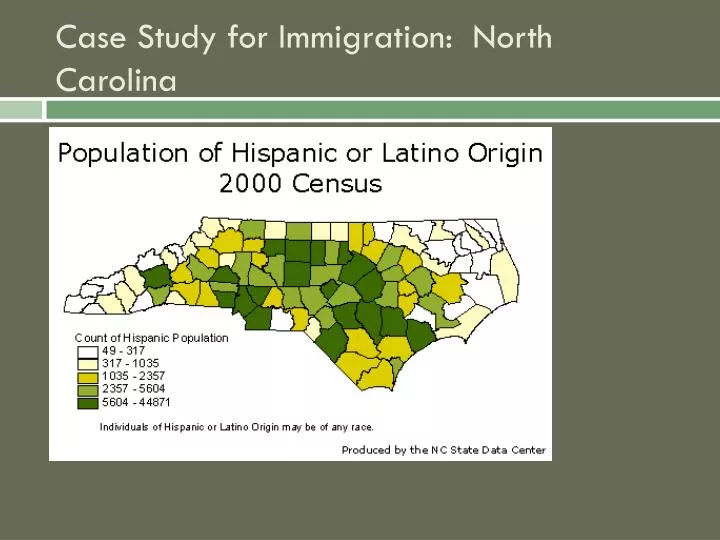
Case Study for Immigration: North Carolina. *North Carolina is representative of the South as a whole *Arkansas has the fastest growing Hispanic population (149%) *The South is attracting people from CA, TX, Mexico etc.., but it is also becoming a site of “family re-unification”. .

E N D
*North Carolina is representative of the South as a whole • *Arkansas has the fastest growing Hispanic population (149%) • *The South is attracting people from CA, TX, Mexico etc.., but it is • also becoming a site of “family re-unification”.
What accounts for recent Hispanic migration to North Carolina? • PUSH *collapse of the “California” dream *high-rents/housing costs *gang activity *MAQUILADORAS • PULL *promise of quiet lifestyle *low rents/housing costs *changes in the configuration of local/regional labor market *labor recruitment -furniture/poultry
Conflict and Accommodation *Context: the historical demography of the American South. • “Nativist backlash” - police harassment - robberies - general cultural unease expressed by locals - political backlash - calls for an end to all immigration - INS - nativist/racist “populism”
America and the New Immigrants: 1965 – the present • 1990; foreign-born population is 8% (20 million) • 2000; foreign-born population is 10% (28 million) • 2008; foreign-born population is 11% (30 million)
“Melting Pot Metros”: metropolitan areas with NO racial/ethnic majority • Miami-Fort Lauderdale • Hispanics 40.3% • Whites 36.3% • Blacks 20.6% • Asians 2.2%
Los Angeles • Hispanics 40.7% • Whites 39.0% • Asians 11.5% • Blacks 7.8%
Close to “metro magnet” status • San Francisco • Whites 50.6% • Asians 20.5% • Hispanics 19.7% • Blacks 7.8%
Chicago-Gary-Kenosha • Whites 59.4% • Blacks 18.8% • Hispanics 16.4% • Asians 4.7%
New Immigrant Typology (types) • 1. Labor Migrants (58%) • 2. Professional Immigrants (33%) • 3. Entrepreneurial Immigrants (5%) • 4. Political Refugees and Asylees (9%)
Median Household Income by Immigrant National Group (1989) • Above national average ($32,000) • Indians 48,320 • Iranians 35,836 • Greeks 33,500 • Around national average • Irish 31,562 • Chinese 30,597 • Jamaicans 30,590 • Poles 29,964 • Below national average • Mexicans 21,926 • Cambodians 19,671 • Ex USSR 19,125
Labor Migrants • Where from? • Mexico • Central America • Eastern Europe • Who? • The most ambitious of the working class, not the poorest of the poor, “relative depravation” • Why? • Wage differentials • Marriage, family reunification • Who supports and who doesn’t? • Dependent businesses support • Unions sometimes do not • Environmentalists sometimes do not
Professional Immigrants • Where from? • China/Taiwan • India • Western Europe • Why? • Relative depravation, reach the upper tiers of their chosen career paths • Role of technology in allowing for “dual citizenship”, and trans-national identity. • Who? • Technical elite, educated elite (HBI Visas) • Who supports, who doesn’t? • Businesses generally support • Environmentalists sometimes do not • Property owners in fast-growing, high-tech areas
Entrepreneurial Immigrants • Where from? • Korea • India • China • Who? • Middle class small business owners • Why? • More transparency, “openness” in the American capitalist system
Political Asylees • Where from? • Countries effected by US military campaigns • Those from communist countries • Those from countries considered by the US government to have dictatorial government • Key distinction here is that is the decisions made by GOVERNMENT that matter • Why? • Human rights policy, geo-political strategy • Who? • Often displaced peasants, and middle-class business owners • Case Studies of Hmong, Vietnamese, Iranians, Cubans
Geography of the New Immigrants • Very Metropolitan (urban) • 95% metropolitan • 5% rural/small town • Highly concentrated pattern (71% in just 5 states) • California • New York • Texas • New Jersey • Illinois
Regional Variance San Francisco – Mexico, Philippines Los Angeles – Mexico, El Salvador Houston – Mexico, El Salvador Chicago – Mexico, Poland New York – Dominican Republic, Jamaica Washington – El Salvador, Korea Miami – Cuba, Columbia
A complex array of factors explain the New Immigration • 1. Legal Framework changes • 2. Globalization • Internationalization of Production • New Labor Demand in the US • G(entrification) • H(igh tech) • I(nformalization of manufacturing) • Specific Actors • Universities • The Military
Changes in the legal framework • 1965 Immigration Act • Reverses the 1924 restrictions • Removes quotas that favor Europe, and Europeans • Family reunification • Political Asylum considerations • HB1 Visas
New Labor Demand in the US • 1: Gentrification (when neighborhoods transition from working-class to professional class
New Labor Demand in US • 2: High-Tech • HB1 Visa increase in tandem with high-tech boom of the 1990s • Decrease after high-tech bust
New Labor Demand in US • 3: Informalization of Manufacturing • Industrial sweatshops • De-unionization • Food processing/packaging has increased in relative importance.
Other Contributing Factors: • 1: Universities • American universities collectively are the largest grouping of post-secondary institutions in the world • Much of “cutting-edge” research occurs in the US (although decreasing a share) • 2: The role of the military • Bases and operations • Past example: Korea, Vietnam, Dominican Republic, Phillippines • Current examples: Afghanistan, Iraq