Download
1 / 45
500 likes | 729 Views
Gravitational Lensing and Quasars . “A man should look for what is, and not what he thinks should be.” – Albert Einstein Arvind Haran and David Johnston. What is Gravitational Lensing?. Let’s take a step back to the Einstein days… General Theory of Relativity

E N D
Gravitational LensingandQuasars “A man should look for what is, and not what he thinks should be.” – Albert Einstein Arvind Haran and David Johnston
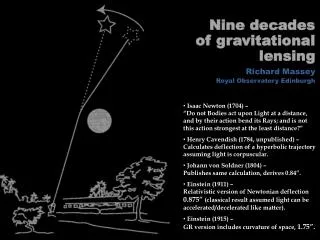
What is Gravitational Lensing? • Let’s take a step back to the Einstein days… • General Theory of Relativity • Space/time is dynamic and changing; not static • Mass bends and changes space • Gravitational Lensing – the act of observing and measuring the mass that bends space-time and the masses that are effected by this
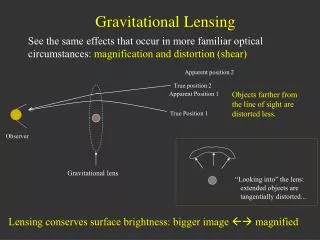
Effects of Gravitational Lensing? • Distortion of light from the background objects • Leads to a distortion in appearance of the object • Distortion of the lensed object’s position in space • HOW!? - Light follows the path through bent space
Background Object(s) Lensing Object Earth
Two Major Types: • Strong Lensing • Easily visible distortions in the lensed object • Einstein Rings, arcs, etc. • Near “perfect” situations • Lens and lensed object are directly in line with each other
Two Types: 2. Weak Lensing • Very small distortions in the lensed object • Need to analyze large number of sources to obtain the average percent of distortion in background objects • From this, we can determine the mass distribution in the area
Background Objects Lensing Object Background Objects
Weak Lensed Background Objects Lensing Object Weak Lensed Background Objects
What are Quasars? • One of the brightest and most energetic objects in the universe • One of the most distant objects in the universe • Believed to lie in the center of massive galaxies • Believed to be powered by supermassive black holes
Our Project: • Quasars = lensing object • Galaxies behind = background sources • Using WEAK GRAVITATIONAL LENSING
Earth QSO Background Galaxies
The Goals: • To measure weak gravitational lensing effects on quasars • To determine whether making these measurements are possible (high signal/noise ratio) • To discover the average mass of quasars • To learn more about the formation of quasars and their origins • Rule out fringe theories about quasars
The Challenges: • Quasars are very distant objects • Many galaxies lie in front of quasars • Potential for high levels of noise • Low amounts of signal • Programming in IDL • I don’t like “for” loops, by the way • Amount of time given
The First Step: • Obtain data of quasars and galaxies • From SDSS.org • SQL search • Searched for: • Quasars with spectra • Photometric galaxies
Galaxy/QSO Distribution • Plotted the “Right Ascension” and “Declination” coordinates of the galaxies/QSO’s • Highlighted galaxies within QSO radius of 1 MPC • Highlighted galaxies within the QSO radius that are more distant than the QSO • Used redshift • This gives us a 3-D map of galaxy and QSO positions in space
Next… • Find the number of Galaxies and QSO’s per Degree^2 • By redshift • This helps determine the numerical distribution of galaxies/QSO’s
Find the # of Pairs • Galaxy Histogram was a cumulative graph, which means that it takes all the galaxies that are greater than that particular redshift. • QSO Histogram simply shows how many QSO’s are present per Deg^2 by redshift. • In order to find the # of pairs, we must find how many galaxies are behind the QSO’s for every redshift bin
QSO (Lens Object)
How? • Find the Area around the quasar • Find the average # of galaxies per quasar • Find the # of quasars per redshift • (# of QSO’s) x (# of background galaxies per QSO) = # of pairs
Variables • A = Area around QSO • Pgals(z) = # of galaxies per Deg^2 • Output values from previous Galaxy Histogram • Ngals(>z) = average # of background galaxies per QSO • Nqso(z) = # of QSO’s per redshift • Output values from previous QSO Histogram • Npairs(z) = # of galaxy/QSO pairs at QSO redshift (z)
Step 1: Area (MPC) Annulus Area: A = π(R2^2 – R1^2)
Step Two: • Find the Average # of Galaxies per QSO (Ngals) • Ngals(>z) = Pgals x A • Pgals = # of galaxies per Deg^2 • A = Area around QSO
Step Three: • Find Npairs(z) • # of Galaxy/QSO pairs • Galaxy must be behind the QSO to be considered a pair • Npairs(z) = Nqso(z) x Ngals(>z) • Nqso(z) = # of QSO’s per redshift • Ngals(>z) = average # of background galaxies per QSO
Trend of Npairs: • As QSO redshift increases, the number of galaxy/QSO pairs decreases • The further away the QSO, the less galaxies are behind it. Therefore, there are less pairs.
Finding the Signal/Noise Ratio • Find Inverse Sigma Crit. • Invsigcrit(z) = strength of weak lensing signal • Invsigcrit = (dL x dLS)/dS • dL = distance to lensing object • dLS = distance from lensing object to background object • dS = distance to background object • Why? • Necessary to determine the signal/shear of the lensed objects
How? • Invsigcrit(z) = (dL x dLS)/dS • depends upon redshift of the lensing object and background objects dS dLS dL Earth Background Galaxies QSO
Finding the Signal/Noise Ratio • Finding the Delta Sigma • Deltsig(r) = mass density around the QSO • Used a program on IDL called “Isotherm” to do determine the delta sigma
Putting them Both Together: • Signal (shear) = invsigcrit(z) x deltasig(r) • Invsigcrit(z) refers to the strength of the lensing as a function of redshift • Deltasig(r) refers to the mass density around a QSO as a function of its radius
To find Noise… • Noise(z,r) = .3/sqrt(Npairs(z)) • Noise is the amount of interference/distortions in measurement • It is a function of redshiftand radius combined • Higher redshift = more noise • Higher radius = less noise
Signal/Noise Ratio • Divide the Signal by the Noise • Since there are many redshifts and many possible radii, we made an array of signal/noise ratios • Results: • Lower redshift and radius = higher sig/noise ratio
Final Result: • With a velocity dispersion set as 100, we determined: • A signal/noise ratio of 39.072175 • With a velocity dispersion set as 200, we determined: • A signal/noise ratio of 156.28870
Conclusion: • We are now sure that it is possible to make measurements on the weak gravitational lensing of quasars as the lensing objects • Optimal Range for Redshift: 0.0 – 0.35 • Many of the goals stated above can be fulfilled if given more time
What I’ve learned: • The basics of programming and IDL • The basic processes of weak gravitational lensing • The importance of accuracy in measurement • How to analyze and utilize data • A TON about astronomy and physics in general.
Special Thanks to: • David Johnston • Chris Stoughton • Jim Browne • George Dzuricsko