Download
1 / 2
20 likes | 331 Views
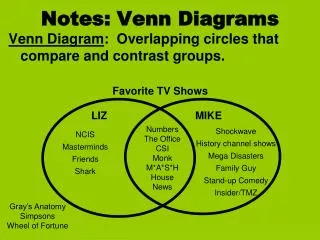
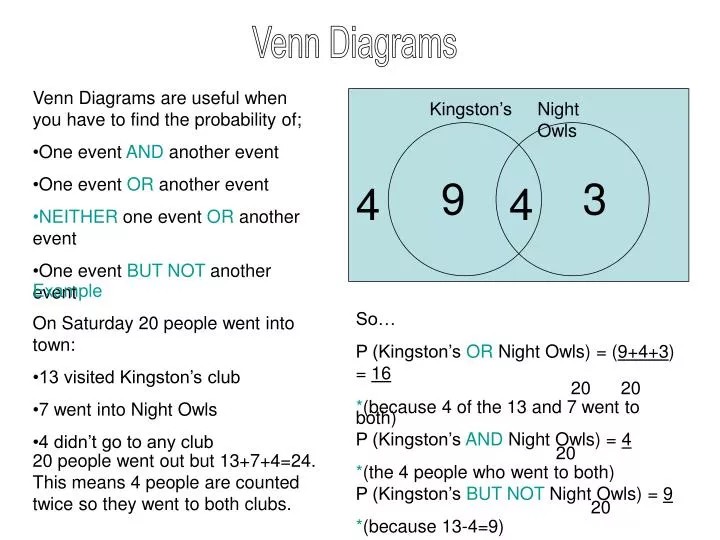
Venn Diagrams. Venn Diagrams are useful when you have to find the probability of; One event AND another event One event OR another event NEITHER one event OR another event One event BUT NOT another event. Kingston’s. Night Owls. 9. 3. 4. 4. Example

E N D
Venn Diagrams • Venn Diagrams are useful when you have to find the probability of; • One event AND another event • One event OR another event • NEITHER one event OR another event • One event BUT NOT another event Kingston’s Night Owls 9 3 4 4 • Example • On Saturday 20 people went into town: • 13 visited Kingston’s club • 7 went into Night Owls • 4 didn’t go to any club So… P (Kingston’s OR Night Owls) = (9+4+3) = 16 20 20 *(because 4 of the 13 and 7 went to both) P (Kingston’s AND Night Owls) = 4 20 *(the 4 people who went to both) P (Kingston’s BUT NOT Night Owls) = 9 20 *(because 13-4=9) 20 people went out but 13+7+4=24. This means 4 people are counted twice so they went to both clubs.
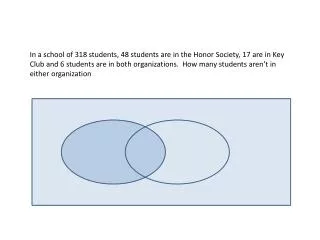
Example Questions EASIER – Liam carried out a survey into what people had for breakfast. Of 44 people asked, 20 had English Breakfast, 7 of these had English Breakfast and cereal and 4 had neither. a) Draw a venn diagram to display the information. b) Calculate the following probabilities: i. P (cereal but not English) ii. P (cereal or English) iii. P (cereal) iv. P (not cereal nor English) HARDER – 200 TV viewers were asked what soaps they watch on Monday night. E stands for Eastenders, C for Coronation Street and N for Neighbours. 26 watched only N, 100 in total watched E, 8 watched all three, 35 watched E and C, 20 watched E and N but not C, 22 watched C and N, and 29 watched none. a) Draw a venn diagram that looks like this: b) Calculate these probabilities: i. P (E and N) ii. P (C) iii. P (E or N) iv. P (E and C not N) N E C