Download
1 / 34
340 likes | 348 Views
This report analyzes the trend in precision soil testing for zone or grid samples compared to total samples tested at AGVISE Laboratories from 1997 to 2017. It includes data on median soil nitrate, phosphorus, potassium, zinc, sulfur, copper, boron, chloride, carbonate, salts, pH, and organic matter levels.

E N D
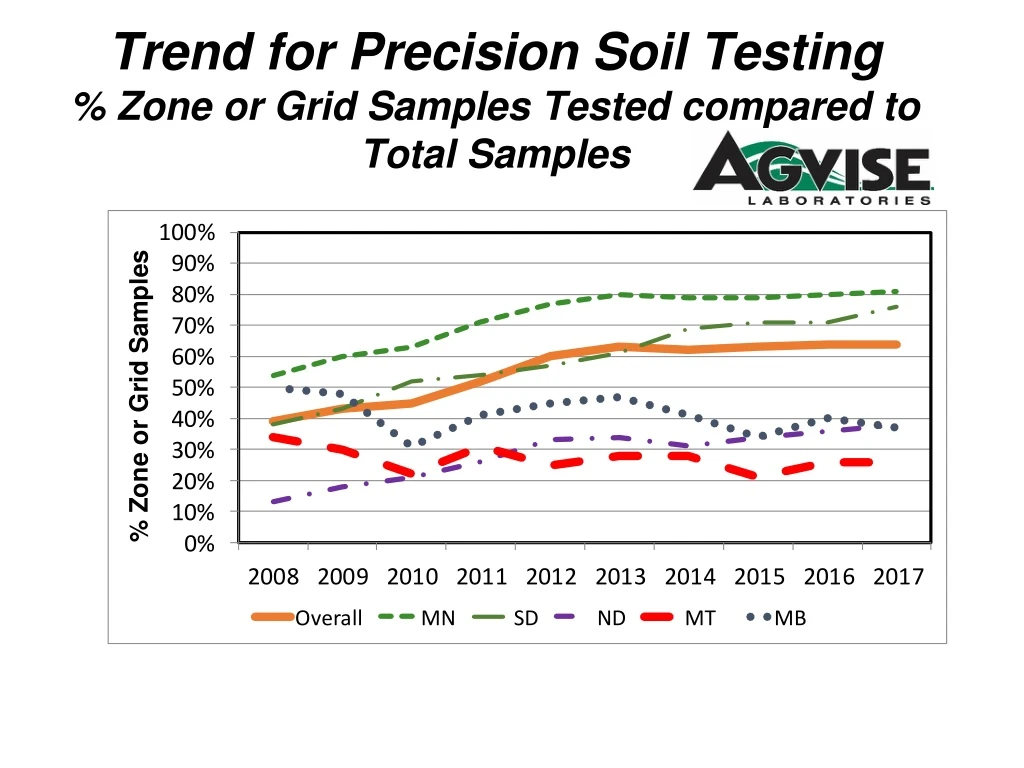
Trend for Precision Soil Testing% Zone or Grid Samples Tested compared to Total Samples
%Zone or Grid Samples Tested Compared to Conventional Whole Field Composite Samples in 2017
AGVISE Laboratories%Zone or Grid Samples – Northwood laboratory1997 - 2017 % Grid or Zone Samples Tested Compared To Conventional Whole Field Composite Samples Tested
Median Soil Nitrate following Wheat in 2017 Fall 2017 samples (lb/a 0-24” samples) 37 53 47 46 28 Median Value Reported based on 50 samples minimum
Soil Nitrate Variability Between Fields Following “WHEAT” in Montana 2016 & 2017
Median Soil Nitrate following Wheat in 2017 MB Fall 2017 Samples 24 (lb/a 0-24” samples) 28 35 45 34 25 29 47 40 59 32 25 ND 43 84 35 26 80 63 40 MN 62 29 SD 61 50
Median Soil Nitrate following “Fallow” in 2017 Fall 2017 samples (lb/a 0-24” samples) 46 42 44 Value Reported based on 50 samples minimum
Soil Nitrate Variability Between Fields Following “Fallow” in Montana 2016 & 2017
% Soil Samples with Phosphorus less than 10 ppm Fall 2017 samples (0-6”) (Olsen P test) 37% 49% 31% 61% 46% 16% Value Reported based on 100 samples minimum
% Soil Samples with Phosphorus less than 10 ppm Fall 2017 samples MB 42% (0-6” samples) 39% (Olsen P test) 49% 48% 27% 65% 29% 21% 29% 66% 65% 64% 52% 57% 67% ND 47% 45% 61% 48% 56% 36% 58% MN 36% 50% 38% SD 31% 39% 33% 34%
% Soil Samples with Potassium less than 150 ppm Fall 2017 samples (0-6”) 1% 4% 3% 25% 10% 33% Value Reported based on 100 samples minimum
% Soil Samples with Potassium less than 150 ppm MB Fall 2017 samples 30% 21% (0-6” samples) 33% 28% 21% 10% 16% 29% 14% 4% 7% 3% 19% 79% 39% ND 9% 23% 60% 11% 46% 7% 43% 5% 6% 26% MN 28% SD 29% 1% 5% 25% 35%
% Soil Samples with Zinc less than 1.0 ppm Fall 2017 samples (0-6”) 87% 81% 78% 66% 54% 72% Value Reported based on 100 samples minimum
% Soil Samples with Zinc less than 1.0 ppm MB Fall 2017 samples 51% 62% (0-6” samples) 59% 66% 35% 87% 48% 27% 43% 69% 89% 81% 41% 68% 47% ND 51% 70% 17% 83% 53 52% 17% 77% 43% MN 52% 24% SD 13% 57% 41% 30% 21%
% Soil Samples with Sulfur less than 15 lb/a Fall 2017 samples (0-6”) 54% 34% 32% 15% 21% Value Reported based on 100 samples minimum
% Soil Samples with Sulfur less than 15 lb/a MB Fall 2017 samples 2% 5% (0-6” samples) 5% 2% 2% 5% 9% 4% 3% 36% 7% 11% 6% 19% 7% ND 14% 77% 13% 20% 27% 29% 80% 55% MN 48% 32% 73% SD 79% 89% 49% 40% 59%
% Soil Samples with Copper less than 0.5 ppm Fall 2017 samples (0-6”) 1% 6% 2% 11% 4% 1% Value Reported based on 100 samples minimum
% Soil Samples with Copper less than 0.5 ppm MB Fall 2017 samples 11% 4% (0-6” samples) 28% 8% 29% 17% 15% 4% 19% 3% 16% 5% 14% 37% 49% ND 11% 52% 12% 33% 15% 12% 36% 24% 12% MN 12% 10% SD 3% 1% 6% 3%
% Soil Samples with Boron less than 0.4 ppm Fall 2017 samples (0-6”) 21% 11% 3% 4% 3% 1% Value Reported based on 100 samples minimum
% Soil Samples with Boron less than 0.4 ppm MB Fall 2017 samples 1% (0-6” samples) 0% 5% 0% 3% 1% 7% 1% 2% 3% 3% 9% 3% 23% 9% ND 3% 88% 13% 25% 3% 11% 51% 16% 16% 17% MN 21% SD 9% 19% 9% 43% 18%
% Soil Samples with Chloride less than 40 lb/a Fall 2017 samples (0-6”) 84% 72% 68% 50% 61% 73% Value Reported based on 100 sample minimum
% Soil Samples with Chloride less than 40 lb/a MB Fall 2017 Samples 52% (0-24” samples) 34% 26% 47% 10% 38% 37% 21% 23% 81% 46% 60% 33% 21% ND 53% 78% 40% 54% 79% 90% 83% 41% MN 67% 70% SD 54% 78% 75%
% Soil Samples with Carbonate greater than 5.0% Fall 2017 samples (0-6”) 4% 15% 25% 36% 13% Value Reported based on 100 samples minimum
% Soil Samples with Carbonate greater than 5.0% MB Fall 2017 samples 43% (0-6” samples) 59% 32% 21% 35% 10% 15% 36% 14% 16% 13% 4% 31% 34% 5% ND 6% 10% 10% 40% 6% 10% 0% 3% MN 14% 26% SD 17% 8% 2% 1%
% Soil Samples with Salts greater than 1.0 mmhos/cm Fall 2017 samples (0-6”) 2% 3% 4% 8% 10% 6% Value Reported based on 100 samples minimum
% Soil Samples with Salts greater than 1.0 MB Fall 2017 Samples 15% 24% (0-6” samples) 17% 21% 37% 17% 13% 19% 23% 5% 26% 11% 43% 20% 7% ND 12% 5% 4% 19% 11% 3% 4% 16% MN 6% 3% SD 1% 1% 3% 8% 5%
% Soil Samples with soil pH greater than 7.3 Fall 2017 samples (0-6”) 69% 75% 74% 87% 89% 84% Value Reported based on 100 samples minimum
% Soil Samples with Soil pH greater than 7.3 MB Fall 2017 samples 72% 97% (0-6” samples) 79% 85% 89% 77% 53% 90% 74% 72% 82% 55% 82% 59% 98% ND 51% 10% 71% 46% 83% 31% 49% 21% 30% MN 43% 58% SD 17% 30% 21% 30% 23%
% Soil Samples with soil pH less than 6.0 Fall 2017 samples (0-6”) 5% 4% 3% 3% 1% 2% Value Reported based on 100 samples minimum
% Soil Samples with Subsoil pH less than 7.0 Fall 2017 samples (0-6”) 3% 2% 1% 1% 1% 10% Value Reported based on 100 samples minimum
% Soil Samples with Soil pH less than 6.0 MB Fall 2017 samples 1% 0% (0-6” samples) 3% 1% 4% 1% 18% 7% 1% 1% 1% 5% 2% 9% 1% ND 4% 29% 2% 12% 3% 13% 16% 15% 11% MN 11% 8% 15% SD 14% 40% 32% 13% 8%
% Soil Samples with %OM less than 3.0% Fall 2017 samples (0-6”) 95% 76% 67% 86% 75% Value Reported based on 100 samples minimum
% Soil Samples with %OM less than 3.0% MB Fall 2017 Samples 7% 6% (0-6” samples) 21% 3% 20% 29% 30% 9% 17% 74% 30% 40% 25% 26% 43% ND 29% 58% 76% 25% 26% 30% 25% 50% MN 26% 13% 11% SD 20% 28% 4% 24% 6%
Zip codes for Montana 599 595 592 594 598 596 593 590-591 597