Download
1 / 14
140 likes | 392 Views
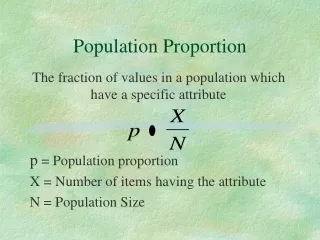
Section 12.1 Inference for a Population Proportion. AP Statistics. Parameters Mean µ Standard Deviation σ Proportion p. Statistics Mean x-bar Standard Deviation s Proportion p-hat. Parameters vs Statistics. What we know about inference.

E N D
Section 12.1Inference for a Population Proportion AP Statistics
Parameters Mean µ Standard Deviation σ Proportion p Statistics Mean x-bar Standard Deviation s Proportion p-hat Parameters vs Statistics AP Statistics, Section 12.1
What we know about inference • We are trying to make sense about what is happening at the population level by looking at sample data • Step 1: “What is the population and the parameter of interest?” • We make assumptions in the form of H0 • Step 1: “What is H0?” • We need to know about the distribution of the sample statistic • Step 2: “Is the distribution of sample means normal?” AP Statistics, Section 12.1
Our inferential work so far… • Has been about the distribution of sample means • and the distribution of the difference of sample means. AP Statistics, Section 12.1
But what about proportions? • We learned in Chapter 9 about the distribution of sample proportions. AP Statistics, Section 12.1
But what about proportions? • We know that the distribution of sample proportions is approximately normal when these conditions are met… • np>10 • nq>10 AP Statistics, Section 12.1
Simulation • A recent study concluded that 25% of all U.S. teenage females have a STD. • Simulate sampling 500 randomly chosen teenage females using… • randBin(500,.25) • Simulate finding the sample proportion by using… • randBin(500,.25)/500 AP Statistics, Section 12.1
Test of significance • A recent sample of 500 female teenagers from southeastern Oakland county found the 22% have an STD. • (I made these numbers up.) • Is this strong evidence to suggest that teenage females from SE Oakland county have a lower infection rate than the national average of 25%? AP Statistics, Section 12.1
3: Calculations 1: Population, Parameter of Interest, H0 and Ha 2: Procedure Name & Conditions 4: Interpret AP Statistics, Section 12.1
Confidence Intervals AP Statistics, Section 12.1
Calculate the Confidence Interval 3: Calculations 1: Population & Parameter of Interest 2: Procedure Name & Conditions 4: Interpret AP Statistics, Section 12.1
Choosing a sample size • We get p* by using previous studies. • Or • We use p*=.5 because this is the most conservative choice. AP Statistics, Section 12.1
We believe that 15% of people are left handed. How large of a sample is needed to get the ME of a 95% CI below 5%? Answer: at least 196. Example AP Statistics, Section 12.1
Exercises • 12.5-12.19 odd AP Statistics, Section 12.1