Download
1 / 11
120 likes | 307 Views
Inference for a Population Proportion. AP Stats Section 12.1. Facts About Proportions. Population Proportion = p Usually given in the problem somehow. Sample Proportion = Usually have to calculate from data in the problem. Assumptions. Data come from a SRS.

E N D
Inference for a Population Proportion AP Stats Section 12.1
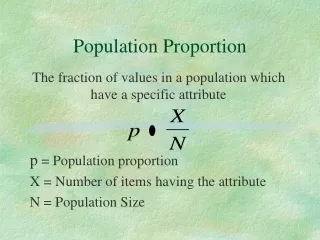
Facts About Proportions • Population Proportion = p • Usually given in the problem somehow. • Sample Proportion = • Usually have to calculate from data in the problem
Assumptions • Data come from a SRS. • Population is at least 10 times as big as the sample size. • Confidence Interval: • Hypothesis Test: np and nq ≥ 10
Confidence Intervals • Formula: • Let’s do pg. 666 #5 with PANIC
Confidence Intervals • P = Parameter of interest is p • A = Assumptions • like before our book omits this quite often, but it looks like a SRS. • Safe to say there are more than 26730 Americans. • N = A one proportion z interval:
Confidence Intervals • I : .0636 ± .0122 .0514 to .0758 • C = We are 99% confident that the true proportion of adult heterosexuals with multiple partners is between .0514 and .0758.
Significance Tests • Hypotheses: • New Null Form is Ho: p = # • New Alternative Form is Ha: p <,>, or ≠ # • Test Statistic: • Back to a z – score • P – value: Use table A again, same process • Conclusions: same
Significance Tests • Let’s do Pg. 666 #6 with PHANTOMS… • P = Parameter of Interest is p. • H = Ho: p = .5 and Ha: p ≠ .5 • A = Assumptions • Tossing a coin is considered a SRS. • Safe to assume that we could toss a coin more than 40400 times. • np = 4040(.5) = 2020 so OK for both.
Significance Tests • N = A one proportion z test. • T = • O = P – Value is 2( .1894) = .3788 • M = Fail to reject the Ho. • C = There is evidence that the coin is fair.
Choosing a Sample Size • New formula: • p* is a given value or use .5 • Make sure to round appropriately! • Let’s do pg. 671 # 8
Calculator Steps • Bet you know where to go!