Download
1 / 32
320 likes | 333 Views
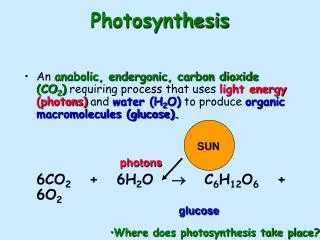
This text explores the process of photosynthesis, starting from the absorption of light by chloroplast pigments to the synthesis of organic compounds. It covers topics such as the structure of chloroplasts, light reactions, the Calvin cycle, and the role of different molecules and pigments in photosynthesis.

E N D
Photosynthesis 0 8
Figure 8.2 40 m (d) Cyanobacteria (a) Plants (b) Multicellular alga 1 m (e) Purple sulfur bacteria 10 m (c) Unicellular eukaryotes
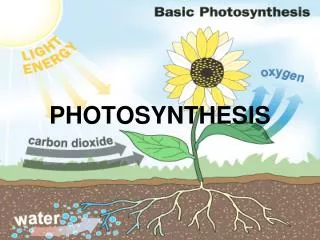
Figure 8.3a Leaf cross section Vein Chloroplasts Mesophyll Stomata CO2 O2
Figure 8.3b Chloroplast Mesophyll cell Outer membrane Thylakoid Granum Thylakoid space Intermembrane space Stroma 20 m Inner membrane 1 m
Figure 8.4 Reactants: 12 H2O 6 CO2 Products: 6 H2O C6H12O6 6 O2
Figure 8.UN01 becomes reduced becomes oxidized
Figure 8.5-4 H2O CO2 Light NADP ADP P i Calvin Cycle Light Reactions ATP NADPH Chloroplast [CH2O] (sugar) O2
Figure 8.6 1 m (109 nm) 103 nm 103 m 10−5 nm 10−3 nm 1 nm 106 nm Micro- waves Radio waves Gamma rays UV Infrared X-rays Visible light 450 500 550 600 700 750 nm 380 650 Longer wavelength Shorter wavelength Higher energy Lower energy
Figure 8.7 Light Reflected light Chloroplast Absorbed light Granum Transmitted light
Figure 8.8 2 3 1 4 Technique Chlorophyll solution Photoelectric tube Refracting prism White light Galvanometer The high transmittance (low absorption) reading indicates that chlorophyll absorbs very little green light. Slit moves to pass light of selected wavelength. Green light The low transmittance (high absorption) reading indicates that chlorophyll absorbs most blue light. Blue light
Figure 8.9a Chloro- phyll a Chlorophyll b Absorption of light by chloroplast pigments Carotenoids 500 400 600 700 Wavelength of light (nm) (a) Absorption spectra
Figure 8.9b Rate of photosynthesis (measured by O2 release) 500 400 600 700 (b) Action spectrum
Figure 8.11 Excited state e− Heat Energy of electron Photon (fluorescence) Photon Ground state Chlorophyll molecule (a) Excitation of isolated chlorophyll molecule (b) Fluorescence
Figure 8.12 Photosystem STROMA Photon Light- harvesting complexes Reaction- center complex Primary electron acceptor Chlorophyll e STROMA Thylakoid membrane Thylakoid membrane Pigment molecules Special pair of chlorophyll a molecules Transfer of energy THYLAKOID SPACE (INTERIOR OF THYLAKOID) Protein subunits THYLAKOID SPACE (a) How a photosystem harvests light (b) Structure of a photosystem
Figure 8.12a Photosystem STROMA Photon Reaction- center complex Light- harvesting complexes Primary electron acceptor e− Thylakoid membrane Pigment molecules Special pair of chlorophyll a molecules Transfer of energy THYLAKOID SPACE (INTERIOR OF THYLAKOID) (a) How a photosystem harvests light
Figure 8.12b Chlorophyll STROMA Thylakoid membrane Protein subunits THYLAKOID SPACE (b) Structure of a photosystem
Figure 8.UN02 H2O CO2 Light NADP ADP Calvin Cycle Light Reactions ATP NADPH [CH2O] (sugar) O2
Figure 8.UN05 Primary acceptor Electron transport chain Primary acceptor Fd Electron transport chain NADP H2O Pq H NADP reductase O2 NADPH Cytochrome complex Pc Photosystem I ATP Photosystem II
Figure 8.14 Mill makes ATP NADPH Photon Photon Photosystem I Photosystem II
Figure 8.13-5 4 7 8 2 3 1 2 1 5 6 Electron transport chain Electron transport chain Primary acceptor Primary acceptor Fd Pq e− NADP e− e− 2 H e− H2O H Cytochrome complex NADP reductase O2 NADPH Pc e− P700 P680 e− Light Light ATP Pigment molecules Photosystem I (PS I) Photosystem II (PS II)
Figure 8.15 CHLOROPLAST STRUCTURE MITOCHONDRION STRUCTURE Inter- membrane space H Diffusion Thylakoid space Electron transport chain Inner membrane Thylakoid membrane ATP synthase Matrix Stroma Key ADP P i ATP Higher [H] H Lower [H]
Figure 8.15a P i CHLOROPLAST STRUCTURE MITOCHONDRION STRUCTURE Inter- membrane space H Diffusion Thylakoid space Electron transport chain Inner membrane Thylakoid membrane ATP synthase Matrix Stroma Key ADP ATP Higher [H] H Lower [H]
Figure 8.UN02 H2O CO2 Light NADP ADP Calvin Cycle Light Reactions ATP NADPH [CH2O] (sugar) O2
Figure 8.16 1 3 2 1 2 P i Cytochrome complex NADP reductase Photosystem I Photosystem II Light 4 H Light H NADP Fd Pq NADPH Pc e− e− H2O O2 THYLAKOID SPACE (high H concentration) 4 H 2 H To Calvin Cycle Thylakoid membrane ATP synthase STROMA (low H concentration) ADP ATP H
Figure 8.UN03 H2O CO2 Light NADP ADP Calvin Cycle Light Reactions ATP NADPH [CH2O] (sugar) O2
Figure 8.17-1 as 3 CO2 Input 3 Phase 1: Carbon fixation Rubisco 3 P P 3 P P 6 P 3-Phosphoglycerate RuBP Calvin Cycle
Figure 8.17-2 as 3 CO2 Input 3 Phase 1: Carbon fixation Rubisco 3 P P 3 P P 6 P 3-Phosphoglycerate RuBP 6 ATP 6 ADP Calvin Cycle 6 P P 1,3-Bisphosphoglycerate 6 NADPH 6 NADP 6 P i 6 P Phase 2: Reduction G3P Glucose and other organic compounds 1 P G3P Output
Figure 8.17-3 as 3 CO2 Input 3 Phase 1: Carbon fixation Rubisco 3 P P 3 P P 6 P 3-Phosphoglycerate RuBP 6 ATP 6 ADP Calvin Cycle 3 ADP 6 P P 3 ATP 1,3-Bisphosphoglycerate 6 NADPH Phase 3: Regeneration of RuBP 6 NADP 6 P i P 5 G3P 6 P Phase 2: Reduction G3P Glucose and other organic compounds 1 P G3P Output
Figure 8.UN06 3 CO2 Carbon fixation 3 5C 6 3C Calvin Cycle Regeneration of CO2 acceptor 5 3C Reduction 1 G3P (3C)
Figure 8.18 1 1 2 2 Pineapple Sugarcane CO2 CO2 C4 CAM Mesophyll cell Night Organic acid Organic acid CO2 CO2 Bundle- sheath cell Day Calvin Cycle Calvin Cycle Sugar Sugar (a) Spatial separation of steps (b) Temporal separation of steps
Figure 8.19 P i H2O CO2 Light NADP ADP Light Reactions: RuBP 3-Phosphpglycerate Photosystem II Electron transport chain Calvin Cycle Photosystem I Electron transport chain ATP G3P Starch (storage) NADPH Chloroplast O2 Sucrose (export)