Download
1 / 6
60 likes | 309 Views
J:CS40Data Analysis- Standard Analysis Package/Sample Standard Analysis Package. EVM Quick-Look Report. Top Issues Summary. Bulls-Eye .

E N D
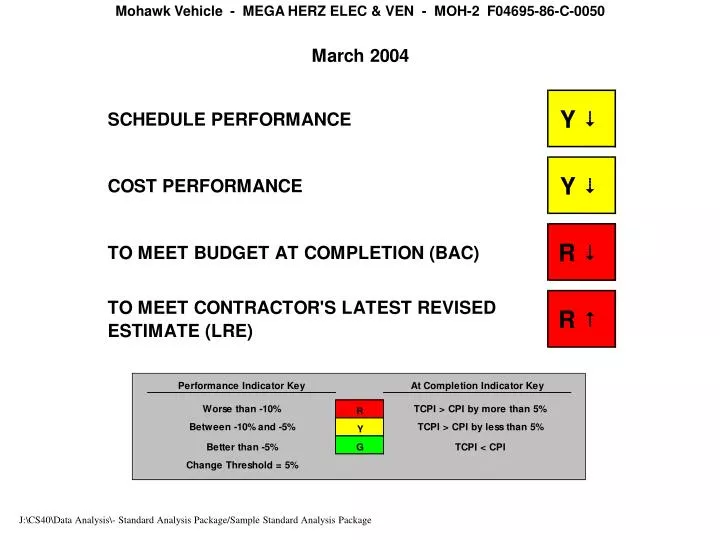
J:\CS40\Data Analysis\- Standard Analysis Package/Sample Standard Analysis Package
Bulls-Eye • The Bulls-Eye Chart provides overall status at a glance. The point labeled '0' represents the status for the current month. The point labeled '1' represents the status one month ago. • The project is currently behind schedule. • The project is currently over cost. • Normally, a negative schedule variance will have a negative impact on cost by program completion. Special attention should be paid to cost for behind-schedule elements as the contract approaches completion. Cost/Schedule Variance • The Cost/Schedule Variance Chart graphically depicts the cost and schedule variances in percentages, and provides the associated values in dollars (in thousands). • Currently, the contractor has an unfavorable schedule variance of -428 (-6%) and an unfavorable cost variance of -499 (-7%) • The Budget at Completion (BAC) is 20,796 and the effort is 33% complete. • The contractor's Latest Revised Estimate (LRE), which depicts their Estimate at Completion (EAC), is 20,761, which is 35 less than the BAC.
Estimate at Completion Validity • The LRE Validity Chart compares the contractor's Latest Revised Estimate (LRE) to several statistically derived values for the Estimate at Completion (EAC). The LRE and EAC are terms that are often used interchangeably, representing the estimate of the total direct charges against the contract. The LRE should be somewhere within the range of the calculated values. • Currently, MEGA HERZ ELEC & VEN LRE of 20,761 is 35 less than the BAC • The LRE appears to be below the range of the statistically derived values. • "Since the LRE falls outside the range of calculated values, the contractor should re-evaluate the LRE as soon as possible." To Complete Performance Index (TCPI) • The To Complete Performance Index (TCPI) chart illustrates the efficiency rate that the contractor must accomplish to meet the BAC or LRE, based on the contractor's performance to date. • To date, the cost performance efficiency has been 0.932. In other words, for each dollar spent, the contractor has accomplished $0.93 worth of the work budgeted. • To meet the BAC, the contractor must accomplish $1.04 of work for each dollar spent. • Given the performance to date, it does not seem likely that the contractor will be able to meet the BAC. • To meet the LRE, the contractor must accomplish $1.04 of work for each dollar spent. • Given the performance to date, it does not seem likely that the contractor will be able to meet the LRE.
USE OF CONTRACTOR PERFORMANCE MEASUREMENT DATA LRE CONTRACTOR BUDGET BASELINE MR ACWP BAC COST VARIANCE BCWS $ BCWP SCHEDULE VARIANCE TIME NOW EVM Definitions TERMINOLOGY ACWP ACTUAL COST OF WORK PERFORMED (ACTUAL COST) BAC BUDGET AT COMPLETION (ALLOCATED BUDGETS) BCWP BUDGETED COST OF WORK PERFORMED (EARNED VALUE) BCWR BUDGETED COST OF WORK REMAINING BCWS BUDGETED COST OF WORK SCHEDULED (PLANNED VALUE) CBB CONTRACT BUDGET BASELINE (TOTAL AUTHORIZED WORK) CPI COST PERFORMANCE INDEX CV COST VARIANCE (BCWP-ACWP) EAC ESTIMATE AT COMPLETION (GOVERNMENT’S EAC) ETC ESTIMATE TO COMPLETE LRE LATEST REVISED ESTIMATE (CONTRACTOR’S EAC) MR MANAGEMENT RESERVE PMB PERFORMANCE MEASUREMENT BASELINE SPI PCHEDULE PERFORMANCE INDEX SV SCHEDULE VARIANCE (BCWP-BCWS) UB UNDISTRIBUTED BUDGET COMMON CAUSES FOR VARIANCE FAVORABLE POOR INITIAL PLANNING OR ESTIMATING TECHNICAL BREAK THROUGH COST OF LABOR AND MATERIAL LOWER THAN PLAN FRONT END LOADING METHOD OF EARNING BCWP UNFAVORABLE POOR INITIAL PLANNING OR ESTIMATING TECHNICAL PROBLEM COST OF LABOR OR MATERIAL HIGHER THAN PLAN INFLATION NEW LABOR CONTRACTS WORK STOPPAGE CPR COST PERFORMANCE REPORT C/SSR COST/SCHEDULE STATUS REPORT PURPOSE: TO OBTAIN CONTRACT COST AND SCHEDULE STATUS INFORMATION ON WHICH TO BASE PROGRAM MANAGEMENT DECISIONS