Download
1 / 33
330 likes | 426 Views
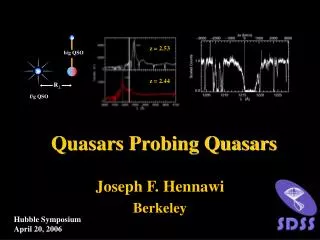
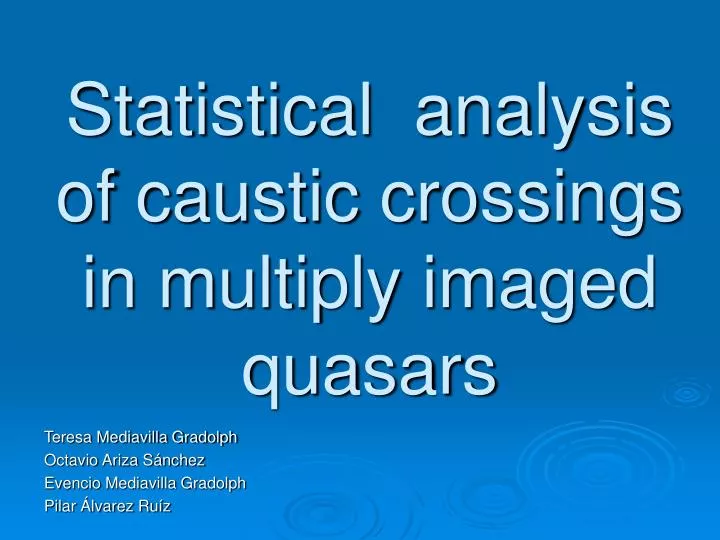
Statistical analysis of caustic crossings in multiply imaged quasars. Teresa Mediavilla Gradolph Octavio Ariza Sánchez Evencio Mediavilla Gradolph Pilar Álvarez Ruíz. Index. Introduction

E N D
Statistical analysis of caustic crossings in multiply imaged quasars Teresa Mediavilla Gradolph Octavio Ariza Sánchez Evencio Mediavilla Gradolph Pilar Álvarez Ruíz
Index Introduction Statistical analysis of the caustics concentration based on caustic crossings counts. Application to QSO 2237+0305 Conclusions
Gravitational mirage Without gravity With gravity
First discovered gravitational lens (QSO 0957+561)
One Source several imagesMagnification X Y T. LIOUVILLE
Simulation and statistical analysis Comparison between observed and simulated microlensed effect allows us to study: Source Size at different wavelengths. Quasar luminosity profile Lens galaxy Mass distribution Microlenses Abundance Mass Lens system Transversal velocity Determination of these parameters can be only statistically done.
Statistical study problems Experimental errors and intrinsical variability can affect data and results
Objectives Simplify the problem reducing microlensing to a series of discrete events, caustic crossings. If the source size is small enough : They appear well separated They are of high magnification They are difficult to mistake with other variability features
Statistical analysis of caustics concentration based on caustic crossings counts. Application to QSO 2237+0305
Analysis steps • Simulate magnification maps for different densities of matter, different mass distribution and shear. • Identify caustic curves • Count the number of caustics detected in a one-dimensional window of certain size in pixels for each axis • Estimate probability of detecting a caustic in a pixel for each axis • Compare experimental distributions obtained in simulations with theoretical binomial distribution. • We have used the method of Inverse Polygon Mapping to carry out two first steps.
Magnification Maps 1 solar mass microlenses A Y B C D Microlenses distributed in a range of masses A Y B C D
Caustics 1 solar mass microlenses C D A Y B Microlenses distributed in a range of masses A Y B C D
Results (I) D IMAGE We can distinguish between A and B hypothesis
Results (II) Can we solve the size / transversal velocity degeneracy?
Results (II) D image microlenses distributed in a range of masses Number of caustics (X axis) > 6 Window > 1.2 Einstein radii Number of caustics (X axis) < 3 Window < 1.2 Einstein radii Number of caustics (Y axis) > 9 Window > 1.2 Einstein radii Number of caustics (Y axis) < 3 Window < 1.2 Einstein radii
Bayesian Analysis D image 400 pixels X axis 400 píxels Y axis In a 76% of cases we can distinguish between both hypothesis with more than 80% of likelihood In a 77% of cases we can distinguish between both hypothesis with more than 70% of likelihood
Conclusions Caustic crossing statistics is affected by the microlenses mass function and by shear. For QSO 2237+0305D detection of a small number of events will allow us to distinguish between unimodal and distributed in a range mass distributions. We could determinate the size of the observing window