Download
1 / 19
190 likes | 295 Views
Second superconducting energy gap of Nb 3 Sn observed by breakjunction point-contact spectroscopy Handoko Shimizu Lab Physical Review B 82, 024507 (2010). Content. . Introduction -. Superconductivity -. Spectroscopy -. Sample structure . Motivation . Experiment

E N D
Second superconducting energy gap of Nb3Sn observed by breakjunction point-contact spectroscopy Handoko Shimizu Lab Physical Review B 82, 024507 (2010)
Content . Introduction -. Superconductivity -. Spectroscopy -. Sample structure . Motivation . Experiment -. Resistivity data -. Specific heat anomaly -. Conductance curve -. Histogram -. Temperature dependence . Comparison -. MgB2 spectra -. Single gap spectra -. Others experiments comparison . Summary
Superconductivity Superconductivity ・ Zero electrical resistance ・ Perfect diamagnetism (Meissner Effect)
Cooper Pair Zero resistance mechanism according to the BCS Theory Many scattering A moving electron attract nearby atom Cooper-Pair formed http://www.nytimes.com/2008/01/08/science/08super.html
Band Gap -.Zero resistance -.Quantized energy level -.There is energy gap -.no energy gap in fermion system -.It’s a boson system -. Cooper-Pair formed -. Coupled pair of electron with opposite spin
Tunneling Spectroscopy ρ = Rn At T = 0 K, (high Rn >> 0) --. no tunneling current can appear if the absolute value of the applied voltage (bias) in the junction is less than Δ/e --. the absence of a tunneling current at small voltage constitute an experimental proof of the existence of a gap in the elementary excitation spectrum of superconductor
Point Contact Spectroscopy Andreev reflection At T = 0 K, (small Rn) --. at V < Δ/e, a hole is retro-reflected and electron is transmitted forming Cooper Pair [Andreev reflection]. --. This process give rise to a charge transfer, i.e. electrical current --. Using conductance curve dI/dV, which contain information on the excitation spectrum (energy gap), gap value can be derived from the position of the maxima in the spectrum, V = ± Δ/e --. Break Junction technique, in which a single sample is broken at low temperature into two pieces that are then brought back into contact
MgB2 Structure hexagonal C32 structure • . Non-oxide intermetallic compound • . Quite high Tc ( ≈ 40 K) The highest Tc among conventional superconductor • . Type II superconductor Increasing magnetic fields gradually penetrates into it.
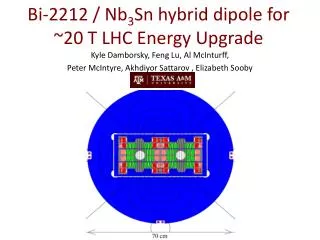
Nb3Sn Structure B A Aβ-W Structure • . Intermetallic Compound A3B V3Si , Nb3Sn , V3Ga. • . Quite high Tc ( ≈ 20 K) The highest Tc before cuprate • . Type II superconductor High upper magnetic field (> 20T). used in MRI, particle accelerator, etc
Motivation To get a basic understanding about second band gap in Nb3Sn
Nb3Sn Resistivity Measurement *. Homogenous sample with very sharp transition at Tc = 18.1 K *. The resistivity ratio RR = ρ(RT)/ ρ(Tc) = 5.2, and ρ(Tc) = 17.2 µΩcm *. No feature caused by the cubic-tetragonal transition is seen in this resistivity data.
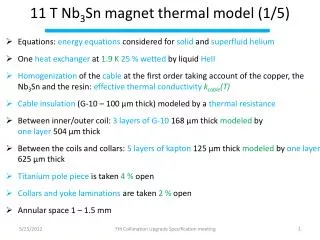
Specific Heat Anomaly BCS single gap model BCS Nb3Sn two gap model Normalize electronic specific heat as a function of temperature • . nonexponential decay and a plateau at low temperature • . anomaly in the specific heat below ~0.25Tc in Nb3Sn and ~0.6Tc in MgB2 a • . The data below ~0.15Tc for Nb3Sn exceed the BCS values by several order of magnitude • . BCS curve : 2Δ0/kBTc = 3.53 • . Single gap curve : 2Δ0/kBTc = 4.7 • Physical review B 70, 184526(2004)
Conductance Curve Δ1 = 3.4 meV ; Δ2 = 1.0 meV *. dI/dV vs V curve shows a huge maximum at V = 0, caused by Josephon current. *. the hysteresis at |V| = 8 - 13 mV is probably caused by a rearrangement of the contact in the electric field (was observed for a few contacts only) However, determining Δ from the peak in dI/dV at finite temperature overestimates the gap value
Histogram At T < 2K Voltage values at which the peaks in dI/dV appeared were summarized in three histograms Feature in the differential conductance curve according to simple semiconductor model, V1 = 2Δ1/e ; V2 = 2Δ2/e V3 = (Δ1+Δ2)/e ; V4 = (Δ1-Δ2)/e Panel A – Large gap at V1 Panel B – Small gap at V2 Δ1 = 4.38 ± 0.03 meV Δ2 = 0.86 ± 0.05meV Panel C : summarize all measured structures Δ1 = 3.92 ± 0.16 meV Δ2 = 0.85 ± 0.17 meV
Temperature Dependence *.Nb3Sn, Tc = 18.1 K -. For increasing temperature, the height of the peak is reduced. -. Small energy gap peak cannot be clearly resolved for the temperature ≥ 8K -. The tendency of the peaks to shift to lower voltage values can be clearly seen.
MgB2 Spectrum *.Tc = 39 K Δ1 = 2.8meV Δ2 = 6.5 - 7 meV -. For increasing temperature, the height of the peak is reduced. -. At T > Tc, the gap feature vanish and the curve gets constant. • P. Szabo et al., Physica C 385 (2003) 244–254
Comparison with Single Gap *.Pt–YB6 , with Tc = 7.4 K *. Δ0 =1.35 meV. *. MgB2, with Tc = 39 K *. Δ1 = 2.8meV ; Δ2 = 6.5 - 7 meV • P. Szabo et al. (2007), Physica C460-462: 626 • P. Szabo et al., Physica C 385 (2003) 244–254
Other Experiments Comparison -. Δ1 in this work is somewhat larger than previous measurement. -. Δ2 is the first spectroscopic confirmation of the existance of the a seond energy gap in Nb3Sn. Reference : Specific heat measurement – Phys. Rev. B 70, 184526 (2004) Nb3Sn / Pt point contact – AIP Conference Proceedings 850, 987 (2006)
Summary . Point-contact measurement can be used to show the existence of superconducting energy gaps spectroscopically . Point-contact measurement of Nb3Sn show the existence of two superconducting energy gaps, Δ1 = 3.92 ± 0.16 meV Δ2 = 0.85 ± 0.17 meV