Download
1 / 19
190 likes | 346 Views
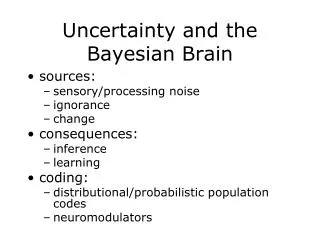
Bayesian evidence for visualizing model selection uncertainty. Gordon L. Kindlmann glk@uchicago.edu. Basic message. • There many different kinds of uncertainty (Rheingans “Ways of not knowing”, Monday) • There’s at least one more kind of uncertainty

E N D
Bayesian evidence for visualizing model selection uncertainty Gordon L. Kindlmann glk@uchicago.edu
Basic message • There many different kinds of uncertainty (Rheingans “Ways of not knowing”, Monday) • There’s at least one more kind of uncertainty Based on an empirical view of data & visualization (not sure if relevant for simulation studies?) • Goal here is to: Define this kind of uncertainty Argue for its relevance Get feedback from you Work initiated by Maxwell Shron (now data scientist for OkCupid); collaboration with Thomas Schultz
Potter et al. "Visualizing Summary Statistics and Uncertainty". Eurovis 2010 pp. 823–832 frequency Pöthkow et al. "Probabilistic Marching Cubes". Eurovis 2011 pp. 931-940 length 20” 22” uncertainty in length due to the measurement process itself One flavor of uncertainty Variance in measurement of scalar (e.g. length)
Jan 2011: Kepler telescope detects rocky planet “Kepler-10b” Finding planets around other stars Decrease in star light intensity due to planet transit Doppler shift in star light color from planet orbit http://en.wikibooks.org/wiki/General_Astronomy/Extrasolar_Planets http://www.nasa.gov/pdf/509370main_Batalha_N_Kepler-10b.pdf Second flavor of uncertainty Variance in parameters of model of data Model: mathematical representation of a hypothesis, parameterized by physically meaningful degrees-of-freedom, to predict measurements
... DK Jones, “Determining and visualizing uncertainty in estimates of fiber orientation from diffusion tensor MRI” Magnetic Resonance in Medicine 49:7-12 (2003) Rheingans & desJardins, “Visualizing High-Dimensional Predictive Model Quality.” Visualization 2000, pp, 493-496. http://www.nasa.gov/pdf/509370main_Batalha_N_Kepler-10b.pdf Second flavor of uncertainty Variance in parameters of model of data => Parameters of models of empirical data are fundamental quantities in the scientific method
Know something about noise => compute likelihood L of the data given particular model parameters Model (2 DOF) Data L(pos,height) peak position peak height = 1/width Maximum Likelihood Estimate height position Second flavor of uncertainty Variance in parameters of model of data Synthetic data and low-DOF model
1 peak: 2 DOF L(pos,height) L(pos,height) L(pos,height) L(pos,height) L(pos,height) L(pos,height) Data Data Data Data Data Data 2 peaks: 4 DOF height position 6 4 8 2 A 0 ???? Proposed new flavor of uncertainty Ambiguity in choice of model to describe data
Goals of visualizing model ambiguity • 1) Understand quality/sufficiency of set of models in novel and complex imaging modalities • Modern imaging produces multiple values per-voxel • Discover spatial/anatomic structure of where models are descriptive, and where not Data Model A Model B Model C Model D
Goals of visualizing model ambiguity • 1) Understand quality/sufficiency of set of models in novel and complex imaging modalities • Modern imaging produces multiple values per-voxel • Discover spatial/anatomic structure of where models are descriptive, and where not • 2) Characterize stability of visualization/analysis with respect to changes in model Data Model A Model B Model C Model D Algorithm Answer A Answer B Answer C Answer D
Single Tensor Model (Basser et al. 1994) : Model Fitting D Si S0 gi Diffusion Tensors from DWI data Diffusion-weighted imaging (DWI) experiment Scalar invariants of tensor: • Bulk mean diffusivity “MD” • Fractional Anisotropy “FA”
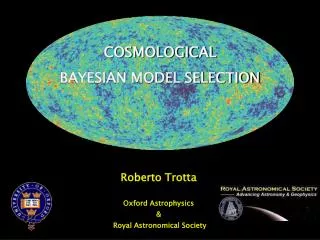
How to quantify model quality? • Can use error (residual) in fit • More DOF => better fit, but less explanatory • Various schemes for penalizing high DOF One method: Bayesian Model Inference Naturally implements Occam’s Razor Cleanly includes probabilistic noise model
B AB ⇒ A Universe Bayes Visualized http://oscarbonilla.com/2009/05/visualizing-bayes-theorem/
D Maximum A Posteriori Estimate Friman et al. “A Bayesian approach for stochastic white matter tractography” IEEE TMI 25:965-978 (2006) height position Prior Likelihood Posterior Bayes for fitting (one, fixed) model Find parameters w of model Mi that maximize posterior probability of the measured data D
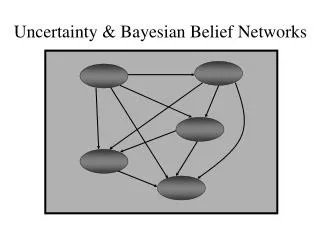
Prior Evidence Evidence constant Likelihood • Evidence: integral of data likelihood over model’s entire parameter space (not specific to single fit) • Perhaps Sum(evidence) shows gaps in models? Bayes for evaluating a model Want to quantify: how plausible is model Mi, as a whole, given the data? • Uncertainty in model choice (of M1 vs M2) is quantified by comparing evidence(M1), evidence(M2)
data(x) = f(y) Evidence(x) x Evidence plots over 1-D domain f(y) = 0 0
data(x) = f(y) Evidence(x) x Evidence plots over 1-D domain 1 f(y) = C 0 f(y) = 0
data(x) = f(y) Evidence(x) x Evidence plots over 1-D domain f(y) = H*bump(y-P) 2 f(y) = H*bump(y) 1 f(y) = C 1
data(x) = f(y) Evidence(x) x Evidence plots over 1-D domain f(y) = H*bump(y-P) 2 f(y) = H*bump(y) 1 f(y) = C 1
Discussion New opportunity for visualization to help understand statistics & add scientific value • Data & models complex; can see how data can be explained, and where it can’t • Can show exactly when simple models suffice, backed up with statistical theory Open research question: how to visualize the multiple scalar fields generated by computing per-pixel model evidences? Thank you!glk@uchicago.edu