Download

1 / 37
• 390 likes • 671 Views
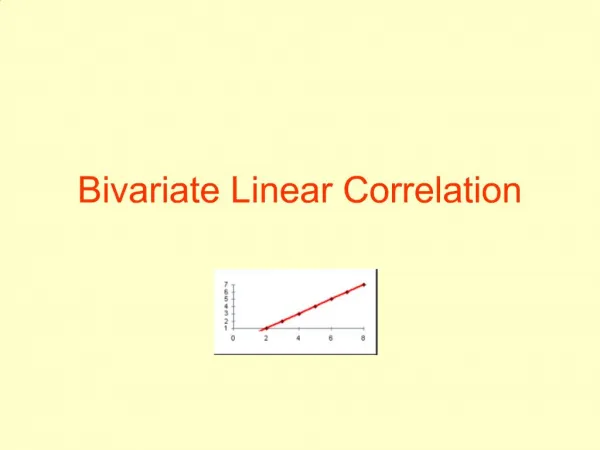
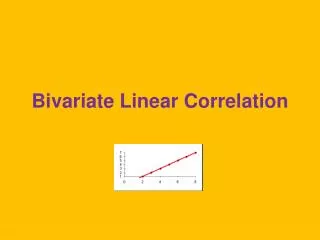
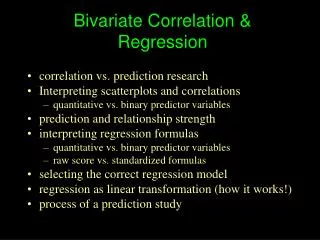
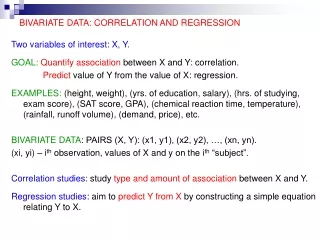
BIVARIATE AND PARTIAL CORRELATION. Bivariate Correlation. Correlation Coefficient Coefficient Of Determination Hypothesis Testing About the Linear Correlation Coefficient. Linear Correlation. Pearson Correlation Spearman rho correlation. Linear Correlation Coefficient.

E N D
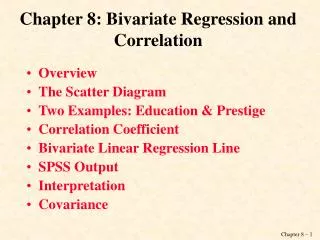
Bivariate Correlation • Correlation Coefficient • Coefficient Of Determination • Hypothesis Testing About the Linear Correlation Coefficient
Linear Correlation • Pearson Correlation • Spearman rho correlation
Linear Correlation Coefficient • Value of the Correlation Coefficient • The value of the correlation coefficient always lies in the range of –1 to 1; that is, • -1 ≤ ρ ≤ 1 and -1 ≤ r ≤ 1
Figure 1 Linear correlation between two variables. (a) Perfect positive linear correlation, r = 1 y r = 1 x
Figure 2 Linear correlation between two variables. (b) Perfect negative linear correlation, r = -1 y r = -1 x
Figure 3 Linear correlation between two variables. (c) No linear correlation, , r ≈ 0 y r ≈ 0 x
Figure 4 Linear correlation between variables. (a) Strong positive linear correlation (r is close to 1) y x
Figure 5 Linear correlation between variables. (b) Weak positive linear correlation (r is positive but close to 0) y x
Figure 6 Linear correlation between variables. y (c) Strong negative linear correlation (r is close to -1) x
Figure 7Linear correlation between variables. (d) Weak negative linear correlation (r is negative and close to 0) y x
Pearson Correlation • The Pearson correlation, denoted by rxy, measures the strength of the linear relationship between two variables for a sample and is calculated as
where and SS stands for “sum of squares”.
Example 1 • Calculate the correlation coefficient • for the data on incomes and food expenditure on the seven households given in the Table 1. Use income as an independent variable and food expenditure as a dependent variable. Table 1. Incomes (in hundreds of dollars) and Food Expenditures of Seven Households
COEFFICIENT OF DETERMINATION • Coefficient of Determination • The coefficient of determination, denoted by • CD = r2xy .100% • represents the proportion of contribution given by • variabel x to variabel y.
Example • For the data of Table 1 on monthly incomes and food expenditures of seven households, calculate the coefficient of determination. • Solution • From earlier calculations • rxy = 0.959 • So, • CD = (0.959)2 x 100% = 91.97 %
Hypothesis Testing About the Linear Correlation Coefficient (Pearson ‘s Correlation) • H0: r = 0 • The correlation coefficient is zero • H1: • The correlation coefficient is positive or negative. Reject H0 If or Do not reject H0 if
Figure Look for this area in the Product Moment table to find the critical values of r. Reject H0 Reject H0 Do not reject H0 -rtabler table
Example 2 • Using the 5% level of significance and the data from Example 1, test whether the linear correlation coefficient between incomes and food expenditures is significant ?. Assume that the populations of both variables are normally distributed.
Solution • H0: r = 0 • There is no correlation significant correlation between the incomes and food expenditures . • H1: r 0 • There is a correlation significant correlation between the the incomes and food expenditures . • The value of the r table =0.754 and rxy =0,959. • rxy > r table • Hence, we reject the null hypothesis
Linear Correlation Coefficient(Spearman rho rank correlation coefficient) • Value of the Correlation Coefficient • The value of the correlation coefficient always lies in the range of –1 to 1; that is, • -1 ≤ ρs ≤ 1 and -1 ≤ rs ≤ 1
Calculate the value of correlation coefficient To Calculate the value of rs, we rank the data for each variable x and y, separately and denote those ranks by u and v, respectively. Thus 1. 2.
Cont…. Where:
Hypothesis about the Spearman rho rank correlation • Hypothesis about the Spearman rho rank correlation coefficient ρs , the test statistic is rs and its observed value is calculate by using the above formula.
Example 1. Suppose we want to investigate the relationship between the per capita income (in 1000 of dollars) and the infant mortality rate (in persent) for different states. The following table gives data on these two variables for a random sample eight states.
Continuu … • Calculate the value of the statistic • Can you conclude that there is no significant correlation between • the per capita income and the infant mortality rates for all states? • Use ρs
Solution a.
Solution • H0: ρs = 0 • There is no correlation significant correlation between the per capita income and the infant mortality rates for all states. • H1: ρs 0 • There is a correlation significant correlation between the per capita income and the infant mortality rates for all states. b.
Because rs=-0.905 is less than -0.738 and we reject H0. We conclude that there is a correlation significant correlation between the per capita income and the infant mortality rates for all states. Because the value of rs from sample is negative, we can also state that as per capita income increase, infant mortality tends to decrease.
Example 2. • Calculate the value of the statistic • Can you conclude that there is no significant correlation between • the per capita income and the infant mortality rates for all states? • Use Rho Spearman.
EXERCISES. • Data berikut menunjukkanurutan (rank) tingkat nilai motivasi (Rx) dan • urutan tingkat prestasi (Ry) 12 orang sampel. • Dari data di samping, tentukanlah: • Koefisien korelasi antara tingkat motivasi (x) • dan tingkat hasil belajar (y). • b. Besar sumbangan yang diberikan x kepada y. • c. uji signifikansi x dengan y.