Download
1 / 26
260 likes | 452 Views
Chapter 4 Graphs of the Circular Function. Section 4.1 Graphs of Sine and Cosine. Section 4.2 Translations of Sin and Cos. Section 4.3 Other Circular Functions. Section 4.1 Graphs of Sin & Cos. Identify Periodic Functions Graph the Sine Function Graph the Cosine Function

E N D
Chapter 4Graphs of the Circular Function Section 4.1 Graphs of Sine and Cosine Section 4.2 Translations of Sin and Cos Section 4.3 Other Circular Functions
Section 4.1 Graphs of Sin & Cos • Identify Periodic Functions • Graph the Sine Function • Graph the Cosine Function • Identify Amplitude and Period • Use a Trigonometric Model
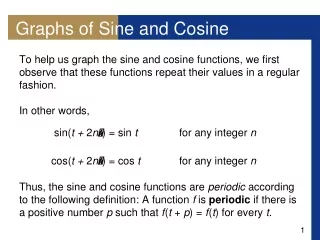
Periodic Functions A periodic function is a function f such that: f(x) = f(x + np) for every real number x in the domain of f, every integer n, and some positive real number p. The smallest possible value of p is the period of the function.
Graph of the Sine Function POSEIDON/TOPEX Imagery
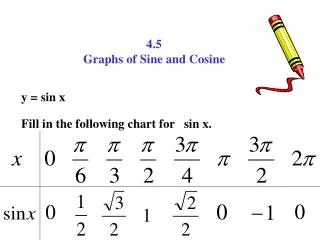
Graph of the Sine Function Characteristics of the Sine Function. Domain: (-ë, ë) Range: [-1, 1] Over the interval [0, é/2] 0 æ 1 Over the interval [é/2, é] 1 æ 0 Over the interval [é, 3é/2] 0 æ -1 Over the interval [3é/2, 2é] -1æ 0 The graph is continuous over its entire domain and symmetric with repeat to the origin. x-intercepts:né Period: 2é
Graph of the Cosine Function Characteristics of the Cosine Function. Domain: (-ë, ë) Range: [-1, 1] Over the interval [0, é/2] 1 æ 0 Over the interval [é/2, é] 0 æ-1 Over the interval [é, 3é/2] -1æ 0 Over the interval [3é/2, 2é] 0æ 1 The graph is continuous over its entire domain and symmetric with repeat to the origin. x-intercepts: é/2 + né Period: 2é
Amplitude of Sine and Cosine Functions Example with a sound wave The graph of y= a sin x or y = a cos x, with a å 0, will have the same shape as the graph of y = sin x or y= cos x, respectively, except with the range [-|a|, |a|]. |a| is called the amplitude.
Period of Sine and Cosine Functions For b> 0, the graph of y = sin bx will look like that of y = sin x, but with a period of 2é/b. Also the graph of y = cos bx will look like that of y = cos x, but with a period of 2é/b.
Guidelines for Sketching Graphs of Sine and Cosine • Find the period • Divide the interval into four equal parts • Evaluate the function for each of the five x-values resulting from step 2. • Plot the points and join them with a sinusoidal curve. • Draw additional cycles on the right and left as needed.
Section 4.2 Translations of the Graphs of Sin and Cos • Understand Horizontal Translations • Understand Vertical Translations • Understand Combinations of Translations • Determine a Trigonometric Maodel using Curve Fitting
Horizontal Translations • A horizontal translation is called a phase shift when dealing with circular functions. In the function y = f(x-d),the expression (x-d) is called the argument with a shift of d units to the right if d >0 and |d| units to the left if d<0.
Vertical Translations The graph of a function of the form y = c + f(x) is translated vertically as compared to the graph of y = f(x) with a shift of c units upif c >0 and |c| units down if c<0.
Combinations of Translations The graph of a function of the form y = c + f(x - d) has both a horizontal and a vertical shift. To graph the function it doesn’t matter which one you look at first.
Determining a Trig ModelUsing Curve Fitting • http://mathdemos.gcsu.edu/mathdemos/sinusoidapp/sinusoidapp.html
Section 4.3 Graphs of the Other Circular Functions • Graph the Cosecant • Graph the Secant • Graph the Tangent • Graph the Cotangent • Understand Addition of Ordinates
Addition of Ordinates • New functions can be formed by combining other functions. Example: y = sin x + cos x • Since the y coordinate is called the ordinate Addition of ordinates means we add to get the y coordinate (x, sin x + cos x) • On the graphing calculator we use Y1= sin x and Y2= cos x with Y3= Y1 + Y2