Download
1 / 1
30 likes | 217 Views
Example research study. Introduction

E N D
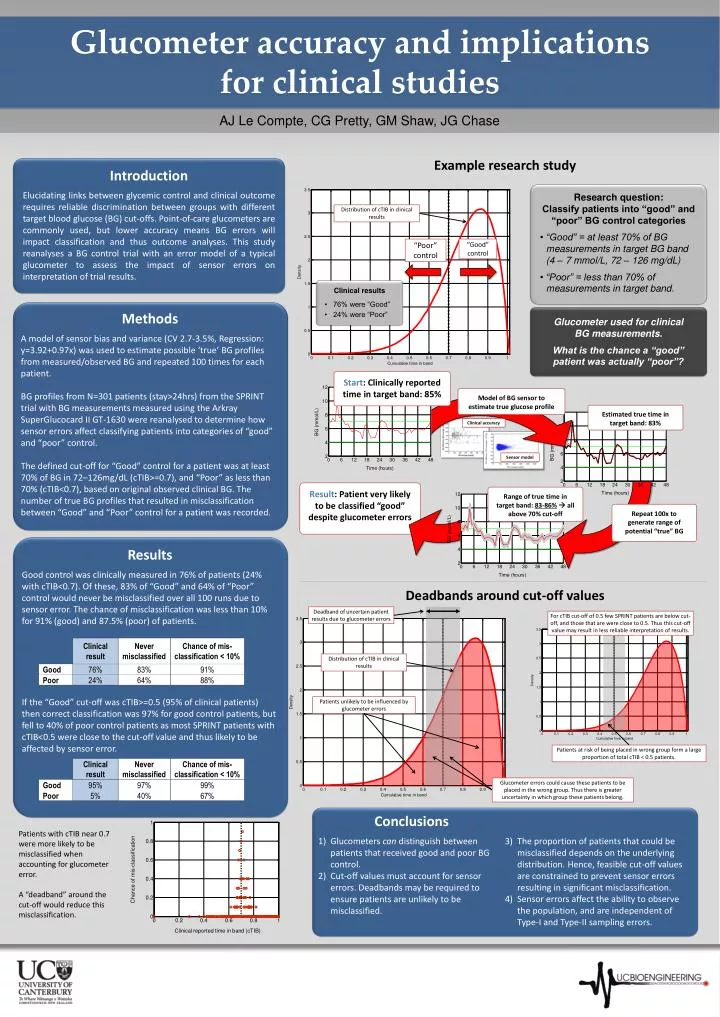
Example research study Introduction Elucidating links between glycemic control and clinical outcome requires reliable discrimination between groups with different target blood glucose (BG) cut-offs. Point-of-care glucometers are commonly used, but lower accuracy means BG errors will impact classification and thus outcome analyses. This study reanalyses a BG control trial with an error model of a typical glucometer to assess the impact of sensor errors on interpretation of trial results. • Research question:Classify patients into “good” and “poor” BG control categories • “Good” = at least 70% of BG measurements in target BG band (4 – 7 mmol/L, 72 – 126 mg/dL) • “Poor” = less than 70% of measurements in target band. Distribution of cTIB in clinical results “Poor” control “Good”control • Clinical results • 76% were “Good” • 24% were “Poor” Methods A model of sensor bias and variance (CV 2.7-3.5%, Regression: y=3.92+0.97x) was used to estimate possible ‘true’ BG profiles from measured/observed BG and repeated 100 times for each patient. BG profiles from N=301 patients (stay>24hrs) from the SPRINT trial with BG measurements measured using the ArkraySuperGlucocard II GT-1630 were reanalysed to determine how sensor errors affect classifying patients into categories of “good” and “poor” control. The defined cut-off for “Good” control for a patient was at least 70% of BG in 72–126mg/dL (cTIB>=0.7), and “Poor” as less than 70% (cTIB<0.7), based on original observed clinical BG. The number of true BG profiles that resulted in misclassification between “Good” and “Poor” control for a patient was recorded. Glucometer used for clinicalBG measurements. What is the chance a “good” patient was actually “poor”? Glucometer accuracy and implicationsfor clinical studies Clinical accuracy Sensor model Start: Clinically reported time in target band: 85% Model of BG sensor to estimate true glucose profile Estimated true time in target band: 83% • Results • Good control was clinically measured in 76% of patients (24% with cTIB<0.7). Of these, 83% of “Good” and 64% of “Poor” control would never be misclassified over all 100 runs due to sensor error. The chance of misclassification was less than 10% for 91% (good) and 87.5% (poor) of patients. • If the “Good” cut-off was cTIB>=0.5 (95% of clinical patients) then correct classification was 97% for good control patients, but fell to 40% of poor control patients as most SPRINT patients with cTIB<0.5 were close to the cut-off value and thus likely to be affected by sensor error. AJ Le Compte, CG Pretty, GM Shaw, JG Chase Result: Patient very likely to be classified “good” despite glucometer errors Deadbands around cut-off values Range of true time in target band: 83-86% all above 70% cut-off Repeat 100x to generate range of potential “true” BG Deadband of uncertain patient results due to glucometer errors For cTIB cut-off of 0.5 few SPRINT patients are below cut-off, and those that are were close to 0.5. Thus this cut-off value may result in less reliable interpretation of results. Distribution of cTIB in clinical results Patients unlikely to be influenced by glucometer errors Patients at risk of being placed in wrong group form a large proportion of total cTIB < 0.5 patients. Glucometer errors could cause these patients to be placed in the wrong group. Thus there is greater uncertainty in which group these patients belong. • Conclusions • Glucometers can distinguish between patients that received good and poor BG control. • Cut-off values must account for sensor errors. Deadbands may be required to ensure patients are unlikely to be misclassified. • The proportion of patients that could be misclassified depends on the underlying distribution. Hence, feasible cut-off values are constrained to prevent sensor errors resulting in significant misclassification. • Sensor errors affect the ability to observe the population, and are independent of Type-I and Type-II sampling errors. Patients with cTIB near 0.7 were more likely to be misclassified when accounting for glucometer error. A “deadband” around the cut-off would reduce this misclassification.