Download
1 / 18
180 likes | 323 Views
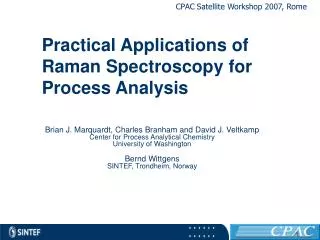
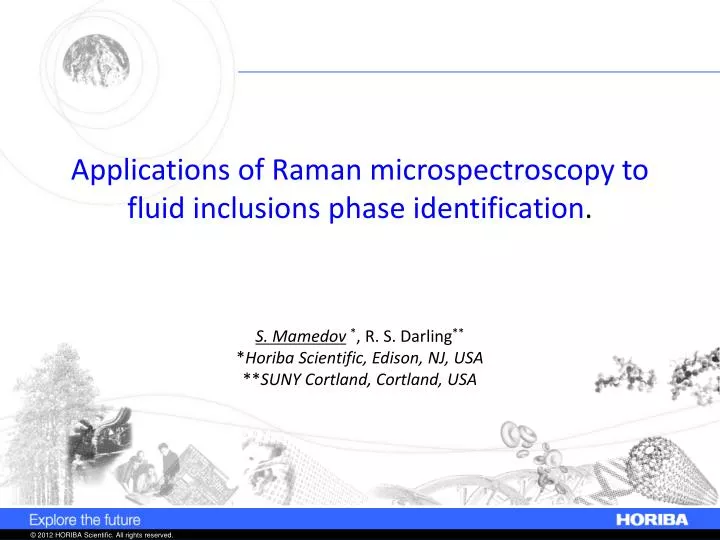
Applications of Raman microspectroscopy to fluid inclusions phase identification . S. Mamedov * , R. S. Darling ** * Horiba Scientific, Edison, NJ, USA ** SUNY Cortland, Cortland, USA. Information from Raman Spectroscopy of Fluid Inclusions.

E N D
Applications of Raman microspectroscopy to fluid inclusions phase identification. S. Mamedov*, R. S. Darling** *Horiba Scientific, Edison, NJ, USA **SUNY Cortland, Cortland, USA
Information from Raman Spectroscopy of Fluid Inclusions • Provide identification of molecules in inclusions such as CO2, CH4, N2, -SH, H2O as an aid to understanding the geochemistry of rock formation as it evolved. • Calibrated relative intensities can provide concentration ratios. • Peak shifts indicate pressure of inclusion. • Maps and depth profiles provide insight into the structure of the inclusion, but are susceptible to artifacts due to the instability in the position of the bubbles.
Experimental Set Up Laser – 532 nm, 25 mW Objective – Olympus x100, N.A. 0.9 Mapping step size – 0.1 microns
Raman spectra of SiO2 Quartz, cristobalite and amorphous SiO2 Intensity
Box vein location in northern NYS. Yellow are Grenville metamorphic & igneous rocks of the Adirondacks, Blue & purple are lower-middle Paleozoic sedimentary rocks. Image of the box vein cavities (now in the NYS museum collection); Source of photo: Dale, N.C., 1924, The box-vein of Lyonsdale, Lewis County, N.Y., New York State Museum Bulletin 251. The quartz-lined cavities contain the secondary CH4inclusions we analyzed.
Inclusion 1 SiO2 CH4 N2 Raman spectrum in the center of the inclusion. Laser 532 nm, confocal hole 1000 microns = spectrum from full depth of inclusion.
Inclusion 1 – distribution of methane, carbon and SiO2 Red – CH4 Green – SiO2 Blue - carbon
Inclusion 1 – depth profile in the center Red – CH4 Green – SiO2 Blue - carbon
Inclusion 1 – depth profile in the center Green – SiO2 Red – CH4 Blue - carbon “Second peak” in methane concentration due to the fact that second order line from carbon between 2878 and 2973 cm-1 overlaps with line of CH4 at 2910 cm-1.
Inclusion 1 Black dots – photo induced damages due to the interaction of the laser beam with something on the inner surface of the inclusion. Spectral features are the same at high and low power (no damages) and it looks like amorphous carbon.
Inclusion 2 – depth profile in the center Red – CH4 Green – SiO2 No carbon detected in this inclusion
Inclusion 2 Inclusion contains water
Inclusion 3 – depth profile in the center Red – CH4 Green – SiO2 No carbon detected in this inclusion
Homogenization Temperatures 1 3 The two inclusions on which Raman data obtained show up lowering the Thmeasurements. Inclusions not probed with the laser give a uniform Th of -82.5C to -82.6C.
Summary Raman spectroscopy is a practical exploration tool to study geological materials including fluid inclusions. With its high spatial resolution, Raman spectroscopy is very useful to determine the composition of the embedded fluids and gas phase. Imaging of fluid inclusion allows obtain information about distribution of liquid and gas phase and detect thin layer of water or carbon on the surface. Light induced changes are observed in some inclusions Inclusions on which Raman spectra obtained show lowering in Th (-85.7C and -94.7 C) but inclusions not probed with the laser give a uniform Th of -82.5C to -82.6C. It was found that there is a shift of 2914 cm-1 band of CH4 to 2910.8 cm-1 which can be explained by high pressure in the inclusion.
Thank you for your attention! 732-623-8284 sergey.mamedov@horiba.com