Download

1 / 11
110 likes | 254 Views
DYNAMO Webinar Series Dynamics of the Madden-Julian Oscillation Field Campaign. Shipboard Measurements of Aerosol Chemical, Physical, and Optical Properties during DYNAMO Timothy Bates, JISAO H. Langley DeWitt, Derek J. Coffman, Kristen S. Schulz, Patricia K. Quinn

E N D
DYNAMO Webinar Series Dynamics of the Madden-Julian Oscillation Field Campaign Shipboard Measurements of Aerosol Chemical, Physical, and Optical Properties during DYNAMO Timothy Bates, JISAO H. Langley DeWitt, Derek J. Coffman, Kristen S. Schulz, Patricia K. Quinn http://saga.pmel.noaa.gov/data Wednesday, June 25, 2014 @ 2pm Climate Variability& Predictability
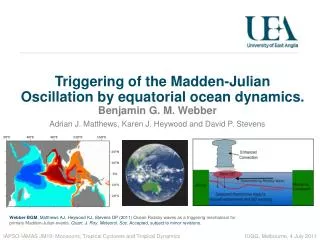
Aerosols in the Indian Ocean November AOT Average: MODIS Anthropogenically Influenced Aerosol Clean Marine Aerosol measurements on the R/V Revelle: Measured the sub and supermicrometer aerosol chemical (filter-based and real-time), physical (size), and optical properties (scattering and absorption)
Aerosols in the Indian Ocean November AOT Average: MODIS How does the MJO affect aerosol properties over the Indian Ocean? How could continental aerosol affect the MJO?
Aerosols and the MJO: Effect of Enhanced MJO Convection on Aerosols (Satellite Measurements) Negative correlation between rainfall and aerosol concentration anomalies (more rain: less aerosol) TOMS Aerosol Index: measures concentration of absorbing aerosol only. MODIS and AVHRR Aerosol Optical Thickness: measures concentration of scattering and absorbing aerosol Positive correlation between rainfall and aerosol concentration anomalies (more rain: more aerosol optical thickness) Tian et al., 2008
Aerosol Source RegionsHYSPLIT backtrajectories Leg 2: Oct 4-Oct 30: More Marine Aerosol Weak MJO event late October Leg 3: Nov 8-Dec 7: More Continental Aerosol Strong MJO event late November 7 day 200 m height aerosol back trajectories October-early December is the shoulder season after the Asian summer monsoon: wind direction over the Indian Ocean changing from primarily southerly to primarily northerly.
Submicron Aerosol Concentration Increased with more Continental Sources Leg 2: Oct 1-Oct 30: Dominant marine aerosol source, primarily acidic sulfate MJO EVENT Leg 3: Nov 8-Dec 7: Dominant continental aerosol source, more ammonium sulfate, nssK+ (biomass burning tracer).
Observed Aerosol Response to the MJO: November 2011 • Suppressed Convection: Increased Convection Enhanced Convection: Wind speed average of ~ 3 m/s, aerosol transport from the Asian continent Increase in O3 as the marine boundary layer height rises, introduction of submicrometer particles from the FT to the MBL. Wind speed average of ~10 m/s, increased precipitation Rainout of continental aerosols, dominance of primary marine (e.g. sea salt) coarse-mode aerosols. Dominance of accumulation mode continental aerosols
MJO Effect on Aerosol Optical Properties: Enhances scattering, absorbing aerosols removed (active convection), suppresses scattering, absorbing aerosols can build up (suppressed convection) Scattering: Sea Salt, Sulfate (SSA~1) Absorbing: Dust (0.7), Biomass Burning (0.85), Black Carbon (0.3): mostly from continental sources
Aerosol chemistry: response to the MJO:Large increase in supermicrometer sea salt aerosol and decrease in submicrometer sulfate, organic, ammonium aerosol
Aerosol Response to the MJO Sea Salt Aerosol Continental Aerosol Cloud Droplets Rain Droplets Enhanced Convection: Heavy precipitation, aerosol rainout Suppressed Convection: Longer aerosol lifetime Increased Convection: Aerosol transport from the free troposphere Enhanced Convection: Sea-salt aerosol formed from breaking waves due to high winds Suppressed Convection: Reintroduction of continental aerosols
Conclusions • Convection associated with the MJO wave greatly affects local aerosol properties. • More continental aerosol transport during the dry season and larger MJO anomaly signal during the dry season. • Aerosol direct and indirect effects on convection potentially enhanced. • Is there a feedback loop between MJO convection and aerosol?