Download
1 / 35
350 likes | 474 Views
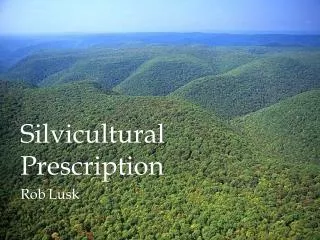
Modeling Tree Growth Under Varying Silvicultural Prescriptions . Leah Rathbun University of British Columbia Presented at Western Mensurationists 2010. Location. Coastal Western Hemlock (CWH) BEC zone Temperatures - 5.2 to 10.5˚ C

E N D
Modeling Tree Growth Under Varying Silvicultural Prescriptions Leah Rathbun University of British Columbia Presented at Western Mensurationists 2010
Location • Coastal Western Hemlock (CWH) BEC zone • Temperatures - 5.2 to 10.5˚ C • Second growth uneven- and even-aged multi-species stands regenerated naturally and from plantings. • Western hemlock, Douglas-fir, western redcedar, red alder, Sitka spruce and yellow cedar
Box-Lucas Model Developed from Von Bertalanffy function Flexible model form
Database for Diameter Growth • Permanent Sample Plot (PSP) data • 1,455 untreated plots • 0.008 to 0.806 ha • 1932 to 2003 • Varying intervals - 1 to 17 years, average of 5.0 years • 13 to 11,750 live trees per hectare • Site Index values from 6.2 to 52.8 m • Average basal area per hectare value of 38.7 m2/ha
Parameter Prediction Approach • Data was subset to obtain estimates for f1 and f2 for a species • Subset defined from untreated data containing at least 4 measurement periods. • Different combinations of predictor variables were used, based upon correlation values • Linear, log-linear, and nonlinear equations • AIC values were used to select model forms • Box-Lucas model was refit using the resultant parameter estimates as starting values.
Variable Selection Tree size and stage of development, site productivity, and inter-tree competition were considered: • dbh, height, and diameter increment • Site index and growth effective age • Curtis’ relative density and basal area per hectare • Basal area of larger, stems per hectare, relative dbh, crown competition factor of larger
Selected Diameter Model Douglas fir: Cedar: Hemlock:
Untreated trees Douglas-fir Cedar Hemlock
Fertilization Effects • 85 plots received fertilization • Majority received one application of nitrogen ranging in concentration from 50 to 400 kg/ha • A few plots additionally received ammonium phosphate.
Fertilization Effects • All three parameters were modified individually • Each possible combination of the three parameters were modified • Akaike’s Information Criteria (AIC) values used to select final model
Fertilization Effects For Douglas fir and cedar: And for hemlock:
Fertilized Douglas-fir Cedar Hemlock
Thinning Effects • 419 plots received a thinning event • Average basal area cut was 8.2 m2/ha • Average of 892 trees per hectare was removed • Original model was fit using parameter estimates found from untreated data • State variables changed immediately following a thin
Thinned Douglas-fir Cedar Hemlock
Fertilized and Thinned Effects • 93 plots received a combination of a thinning followed by fertilization • Fertilization was applied within the measurement period following thinning • Fertilized model was fit using parameter estimates found from fertilized data • State variables changed immediately following a thin
Fertilized & Thinned Douglas-fir Cedar Hemlock
Database for Height Growth • 1,316 untreated plots • 0.008 to 0.253 ha • 1932 to 1996 • Varying intervals - 1 to 30 years, average of 4.8 years • 222 to 11,750 live trees per hectare • Site Index values from 10.7 to 52.8 m • Average basal area per hectare value of 38.1 m2/ha
Potential Height Model • Data selection • Binning by dbh (90th and 99th percentiles) • Predicted values approach • Box-Lucas model fit using dbh and a transformation of dbh in a linear model for f1 and f2 • Predict 90th and 99th percent confidence interval, upper value • Fit Box-Lucas model using dbh and a transformation of dbh in a linear model for f1 and f2
Potential Height Model • Binning approach: • - f1: dbh0.5 for Douglas-fir and ln(dbh) for cedar and hemlock • f2: dbh2 for Douglas-fir and cedar and ln(dbh) for hemlock • Predicted values approach: • - f1: dbh2 for Douglas-fir and ln(dbh) for cedar and hemlock • f2: dbh2 for Douglas-fir and cedar and ln(dbh) for hemlock
Potential height Douglas-fir Western redcedar Western hemlock
Average Height ModelGrowth Potential Dependent • Douglas-fir • Cedar • Hemlock
Average Height ModelGrowth Potential Independent Douglas fir: Cedar: Hemlock:
Average height Douglas-fir Cedar Hemlock
Fertilization Effects • 82 plots received fertilization • All three parameters were modified individually • Each possible combination of the three parameters were modified • Akaike’s Information Criteria (AIC) values used to select final model
FertilizedDouglas-fir a)Low site quality, low density b)High site quality, low density c)High site quality, high density
FertilizedHemlock a)Low site quality, low density b)Low site quality, high density c)High site quality, low density d)High site quality, high density
Thinning Effects • 388 plots received a thinning event • Average basal area cut was 7.6 m2/ha • Average of 988 trees per hectare was removed • Original model was fit using parameter estimates found from untreated data • State variables changed immediately following a thin
ThinnedDouglas-fir a)Low site quality, low density b)Low site quality, high density c)High site quality, low density d)High site quality, high density
ThinnedCedar a)Low site quality, low density b)High site quality, low density c)High site quality, high density
ThinnedHemlock a)Low site quality, low density b)High site quality, low density c)High site quality, high density
Fertilized and Thinned Effects • 92 plots received a combination of a thinning followed by fertilization • Fertilization was applied within the measurement period following thinning • Fertilized model was fit using parameter estimates found from fertilized data • State variables changed immediately following a thin
Fertilized & ThinnedDouglas-fir a)Low site quality, low density b)Low site quality, high density c)High site quality, low density d)High site quality, high density
Fertilized & ThinnedHemlock a)Low site quality, low density b)Low site quality, high density c)High site quality, low density d)High site quality, high density
Conclusions • Box-Lucas model works well • Silvicultural treatments applied to managed stands, not experimentally designed study • The adjustments added for fertilization worked well • Modification of state variables only modeled the effects of thinning well for Douglas-fir • Separate models are recommended for potential and average height
Acknowledgements • Dr. Valerie Lemay • Dr. Nick Smith • Dr. Peter Marshall • Dr. Lori Daniels • Ken Epps and Island Timberlands • FVS group at the U.S. Forest Service