Download
1 / 42
450 likes | 469 Views
Explore patterns, strengths, and interpretations of correlation between variables for effective prediction in research studies. Learn about scatter diagrams, correlation coefficients, causality issues, and multiple regression.

E N D
Correlation and Prediction Chapter 3
Chapter Outline • Graphing Correlations: The Scatter Diagram • Patterns of Correlation • The Correlation Coefficient • Issues in Interpreting the Correlation Coefficient • Prediction • The Correlation Coefficient and Proportion of Variance Accounted for • Correlation and Prediction in Research Articles • Advanced Topic: Multiple Regression • Advanced Topic: Multiple Regression in Research Articles
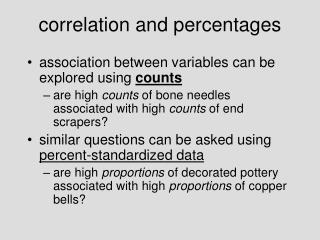
Correlations • Can be thought of as a descriptive statistic for the relationship between two variables • Describes the relationship between two equal-interval numeric variables • e.g., correlation between amount of time studying and amount learned • e.g., correlation between number of years of education and salary
Correlation instruct.uwo.ca/geog/500/correlation_by_6.pdf
Scatter Diagram or Scatter Plot Graph showing the pattern o f the relationship between two variables
Patterns of Correlation • A linear correlation • relationship between two variables on a scatter diagram roughly approximating a straight line • Curvilinear correlation • any association between two variables other than a linear correlation • relationship between two variables that shows up on a scatter diagram as dots following a systematic pattern that is not a straight line • No correlation • no systematic relationship between two variables
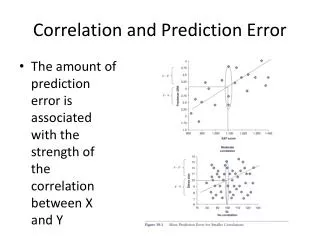
Positive and Negative Linear Correlation • Positive Correlation • High scores go with high scores. • Low scores go with low scores. • Medium scores go with medium scores. • e.g., level of education achieved and income • Negative Correlation • High scores go with low scores. • e.g., the relationship between fewer hours of sleep and higher levels of stress • Strength of the Correlation • how close the dots on a scatter diagram fall to a simple straight line
Zero Correlation ludwig-sun2.unil.ch/~darlene/Rmini/lec/20021031.ppt
Curvilinear Relationship ludwig-sun2.unil.ch/~darlene/Rmini/lec/20021031.ppt
How Are You doing? • What does it mean when two variables have a curvilinear relationship? • True or False: When two variables are negatively correlated, high scores go with high scores, low scores go with low scores, and medium scores go with medium scores.
The Correlation Coefficient • Number that gives exact correlation between 2 variables • can tell you direction and strength • uses Z scores to compare scores on different variables • Z scores allow you to calculate a cross-product that tells you the direction of the correlation. • A cross-product is the result of multiplying a score on one variable by a score on the other variable. • If you multiply a high Z score by a high Z score, you will always get a positive cross-product. • If you multiply a low Z score by a low Z score, you will always get a positive cross-product. • If you multiply a high Z score with a low Z score or a low Z score with a high Z score, you will get a negative number.
The Correlation Coefficient ( r ) • The sign of r (Pearson correlation coefficient) tells the general trend of a relationship between two variables. • A + sign means the correlation is positive. • A - sign means the correlation is negative. • The value of r ranges from 0 to 1. • 1 is the highest value a correlation can have. • A correlation of 1 or -1 means that the variables are perfectly correlated. • 0 = no correlation • The value of a correlation defines the strength of the correlation regardless of the sign. • e.g., -.99 is a stronger correlation than .75
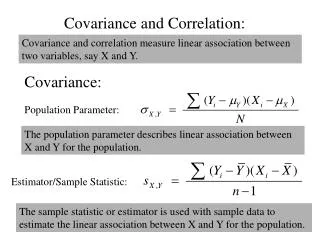
Formula for a Correlation Coefficient • r = ∑ZxZy N • Zx = Z score for each person on the X variable • Zy = Z score for each person on the Y variable • ZxZy = cross-product of Zx and Zy • ∑ZxZy = sum of the cross-products of the Z scores over all participants in the study
Pearson Correlation Coefficient • Pearson correlation coefficient“r” is the average value of the cross-product of ZX and Zy • r is a measure of LINEAR ASSOCIATION (Direction: + vs. – and Strength: How much
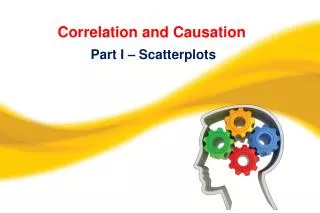
Issues in Interpreting the Correlation Coefficient • Direction of causality • path of causal effect (e.g., X causes Y) • You cannot determine the direction of causality just because two variables are correlated.
Three Possible Directions of Causality • Variable X causes variable Y. • e.g., less sleep causes more stress • Variable Y causes variable X. • e.g., more stress causes people to sleep less • There is a third variable that causes both variable X and variable Y. • e.g., working longer hours causes both stress and fewer hours of sleep
Ruling Out Some Possible Directions of Causality • Longitudinal Study • a study where people are measured at two or more points in time • e.g., evaluating number of hours of sleep at one time point and then evaluating their levels of stress at a later time point • True Experiment • a study in which participants are randomly assigned to a particular level of a variable and then measured on another variable • e.g., exposing individuals to varying amounts of sleep in a laboratory environment and then evaluating their stress levels
The Statistical Significance of r • A correlation is statistically significant if it is unlikely that you could have gotten a correlation as big as you did if in fact there was no relationship between variables. • If the probability (p) is less than some small degree of probability (e.g., 5% or 1%), the correlation is considered statistically significant.
Key Points • Two variables are correlated when they are associated in a clear pattern. • A scatter diagram displays the relationship between two variables. • A linear correlation is seen when the dots in a scatter diagram generally follow a straight line. In a curvilinear correlation, the dots follow a pattern that does not approximate a straight line. When there is no correlation, the dots do not follow a pattern. • In a positive correlation, the highs go with the highs, the lows with the lows, and the mediums go with the mediums. With a negative correlation, the lows go with the highs. • r is the correlation coefficient and gives you the direction and strength of a correlation. r = (∑Zx Zy )/N • The maximum positive value of r = 1 and the maximum negative value of r = -1. • The closer the correlation is to -1 or 1, the stronger the correlation. • Correlation does not tell you the direction of causation. • Prediction model using Z scores = predicted Zy = ()(Zx). • Prediction model with raw scores = predicted Y = (SDy)(predicted Zy) + My. • r2 = proportion of variance accounted for and is used to compare linear correlations • Correlation coefficients are reported both in the text and in tables of research articles.