Download

1 / 36
360 likes | 490 Views
Academic Achievement Highlights. San Francisco Unified School District August 2013. Districtwide Results. +3.5. +2.3. +1.1. +3.1. -0.3. CST English Language Arts: Trend for Proficient and Above (Grades 2 to 11). +2.9. +1.6. +2.9. +0.8. +1.6.

E N D
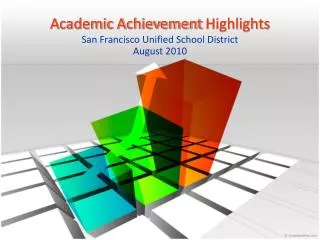
Academic AchievementHighlights San Francisco Unified School District August 2013
+3.5 +2.3 +1.1 +3.1 -0.3 CST English Language Arts:Trend for Proficient and Above(Grades 2 to 11)
+2.9 +1.6 +2.9 +0.8 +1.6 CST Mathematics:Trend for Proficient and Above(Grades 2 to 7)
+2.9 +1.6 +1.9 +0.2 +0.2 CST Mathematics:Trend for Proficient and Above(Grades 2 to 7, and End-of-Course)
+2.3 +5.6 +1.3 +1.2 -1.1 CST Science:Trend for Proficient and Above(Grades 5, 8, and 10)
+3.9 +3.9 +0.8 -1.3 +3.2 CST History:Trend for Proficient and Above(Grades 8 and 11, and End-of-Course)
CST English Language Arts:Trend for Proficient and Above(Grades 2 to 11)
CST Mathematics:Trend for Proficient and Above(Grades 2 to 7)
CST 8th Grade Algebra 1 or higher:Trend for Test Participation Rate * n=2,395 n=3,084 n=3,256 n=2,960 n=3,196 n=2,512 *8th Grade Algebra 1 or Higher Test Participation Rate = # of Algebra 1 or Higher Test Takers / # of 8th Grade Test Takers
+10 +11 +15 +9 CST English Language Arts:Trend for Proficient and Above(Grades 2 to 11)
CST English Language Arts:Trend for Proficient and Above(Grades 2 to 11)
+12 +11 +13 +15 CST Mathematics:Trend for Proficient and Above(Grades 2 to 7)
CST Mathematics:Trend for Proficient and Above(Grades 2 to 7)
+11 +1 CST English Language Arts:Trend for Proficient and Above(Grades 2 to 11)
English Language Arts:Trend for Proficient and Above(Grades 2 to 11) N = 457 459 481 481 458 444 N = 3,306 2,600 2,333 1,920 2,094 2203 N = 433 713 1,445 1,733 1,880 1,860
+9 +4 CST Mathematics:Trend for Proficient and Above(Grades 2 to 7, and End-of-Course)
Mathematics:Trend for Proficient and Above(Grades 2 to 7, and End-of-Course) N = 456 452 477 478 456 443 N = 358 628 1,119 1,563 1,646 1,641 N = 3,288 2,813 2,436 2,196 2,286 2,376
+9 +15 +18 CST English Language Arts:Trend for Proficient and Above(Grades 2 to 11) Implementation of SIG Schools in 2011 Implementation of Sup Zones in 2010 Over 3 years (2011-2013) increase in Proficiency Rate is 5% for Sup Zones, and 7% for SIG Schools.
+10 +26 +31 CST Mathematics:Trend for Proficient and Above(Grades 2 to 7) Implementation of Sup Zones in 2010 Implementation of SIG Schools in 2011 Over 3 years (2011-2013) increase in Proficiency Rate is 14% for Sup Zones, and 17% for SIG Schools.
+6 +21 +24 CST Mathematics:Trend for Proficient and Above(Grades 2 to 7, and End-of-Course) Implementation of Sup Zones in 2010 Implementation of SIG Schools in 2011 Over 3 years (2011-2013) increase in Proficiency Rate is 12% for Sup Zones, and 14% for SIG Schools.
SFUSD Satisfaction Surveys 2013 88.1% of responses indicated satisfaction with various aspects of the school district
California High School Exit Exam Grade 10 in English-Language Arts
CST English Language Arts:SFUSD compared to the State by Grade (Grades 2 to 11)
CST Mathematics:SFUSD compared to the State by Grade (Grades 2 to 7)