Download
1 / 49
610 likes | 986 Views
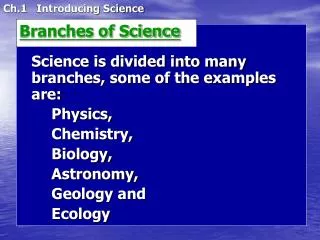
Branches of science . Ch. 1.1. Science. A system of knowledge that apply methods to find new knowledge Begin with curiosity, end in discovery! Qualitative= descriptive Quantitative= numerical Goal= expand knowledge. Technology. The use of knowledge to solve practical problems

E N D
Branches of science Ch. 1.1
Science • A system of knowledge that apply methods to find new knowledge • Begin with curiosity, end in discovery! • Qualitative= descriptive • Quantitative= numerical • Goal= expand knowledge
Technology • The use of knowledge to solve practical problems • Goal= apply knowledge gained from science
Science Technology Interdependent: advances in one lead to advances in the other
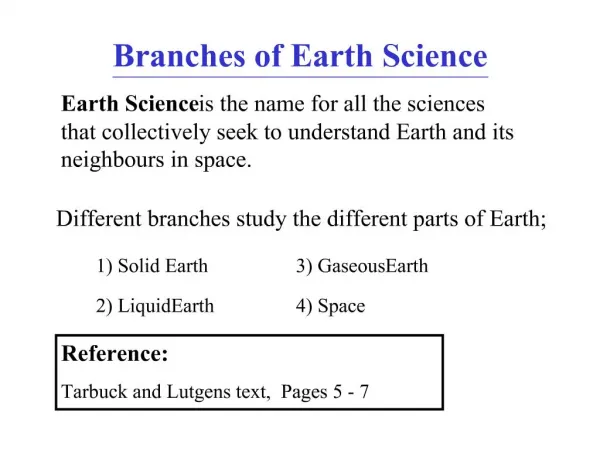
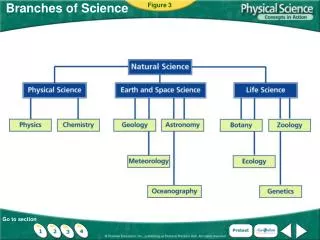
Natural Science • 3 main branches • Physical Science • Earth & Space Science • Life Science
Physical Science Chemistry Physics • Study of the composition, structure, properties and reactions of matter • Study of matter, energy and the interactions between the 2 through forces and motion
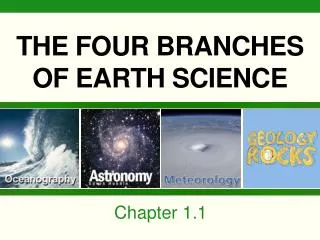
Earth and Space Science Geology Astronomy • Study of the origin, history and structure of earth • Study of the universe, beyond earth
Life Science (biology) Botany Zoology The study of living things
Scientific Approach Ch. 1.2
Scientific Method • Organized plan • Gathering, organizing, and communicating info • Goal= solve problems, or understand an event
Steps • 1. State the Problem • Question format • Based on observations • Ex: • 2. Research the Problem • Gather information • Journals, articles, interviews • Ex:
3. Form a Hypothesis • Probable solution to the problem • Educated guess as to what will solve the problem • If-Then format • Ex:
4. Conduct an Experiment • Independent Variable (manipulated) • “I” Change on purpose • Ex: • Dependent Variable (responding) • Changed due to what you changed • Ex: • Control • Group or object that does not change • No IV added • Ex: • Constant • Condition that remains the same
5. Record/analyze data • Results in tables • 6. Conclusion • What does the data mean? • Was hypothesis correct? • Evidence to support hypothesis • Evidence doesn’t support hypothesis • Revise and try again • 7. Repeat experiment • Must get same results over and over to be VALID
Law vs Theory • Repeatedly tested • Summarizes patterns in nature • Doesn’t try to explain patterns • Hypothesis repeatedly supported • Well tested explanation • Never proved • Become stronger • Can be revised or replaced • Explains patterns
Models • Make it easy to understand things that are too difficult to observe directly • Ex: Earths rotation • New continually replace old • Mental Models • Comets are like giant snowballs made of ice • Physical Models • Maps, drawings
Measurement Ch. 1.3
Scientific Notation • Short hand way to express very large or small #’s • Speed of light = 300,000,000 m/s • Scientific Notation 3.0 x 10⁸ m/s • #’s greater than 1 are + • #’s less than 1 are -
Steps to Scientific Notation Step 1: • Count the amount of decimal places that must be moved to make the original number between one and ten. Step 2: • Write this amount as the exponent above the ten. Make the exponent positive = move left and negative= move right.
Examples • Convert 2,530,000 • Step 1) 2,530,000 • Step 2) We moved decimal places to the left, so we know that the exponent above the ten will be positive 6. • Convert 0.0000000523 • Step 1) 0.0000000523 • Step 2)
Practice • 1) 287 • 2) 840,000 • 3) 0.0000683 • 4) 603,400,000 <1 = negative, >1 = positive
Practice • 1.) 5.89 x 10 5 • 2.) 3.45 x 10⁻³ • 3.) 7.0 x 10⁵ • 4.) 1.23 x 10⁻⁶ - Move decimal left, + move decimal right
Scientific Notation • Multiplying • Multiply #s • Add the exponents • 3.0 x 108 x 5.0 x 102 = 1.5 x 10¹¹ • Dividing • Divide #s • Subtract exponents • 1.5 x 10¹¹ 3.0 x 10⁸ • (2.8 x 108) x (1.9 x 104)= • (4.9 x 1024) (1.6 x10⁵) = • (3.6 x104) x (6x 105)= • (1.44 x 1024) x (1.2x 1017)= = 5.0 x 10²
SI Units of Measurement • System International d’Unites developed by French • Metric System • Used by scientists globally
Base Units • Length- straight line distance between 2 points • Meter • Mass- quantity of matter in an object • Kilogram • Volume- amount of space taken up by an object • Cubic meter, m3 • Density- ratio of objects mass to volume • Kg/m3
Practice • Convert • 125 kg= _______ g • 0.146cm= _______Hm • 39 s= ______Ds
Metric Prefixes • Indicates how many times a unit should be multiplies or divided by 10
Conversion Factors • Ratio of equivalent measurements used to convert 1 quantity into another • 8848m=km? 1km 1000m 1000m 1km 8848 m x 1 km 1000m = 8.848 km
Precision Accuracy • Gauge of how exact a measurement is • Limited by the least precise measurement used to calculate • Significant Figures! • Closeness of a measurement to actual value of what is being measured
Accurate & Precise Accurate not Precise Not Accurate or Precise Precise not accurate
Significant Figures Rules: • 1) ALL non-zero numbers (1,2,3,4,5,6,7,8,9) are ALWAYS significant. • 2) ALL zeroes between non-zero numbers are ALWAYS significant. • 3) ALL zeroes which are SIMULTANEOUSLY to the right of the decimal point AND at the end of the number are ALWAYS significant. • 4) ALL zeroes which are to the left of a written decimal point and are in a number >= 10 are ALWAYS significant. • A helpful way to check rules 3 and 4 is to write the number in scientific notation. If you can/must get rid of the zeroes, then they are NOT significant.
Use the least precise measurement • Mass=34.73g • Volume=4.42cm3 • Density= 34.73 4.42cm3 = 7.85766g/cm3
Adding/Multiplying • The answer cannot CONTAIN MORE PLACES AFTER THE DECIMAL POINT THAN THE SMALLEST NUMBER OF DECIMAL PLACES in the numbers being added or subtracted. 23.987 + 9.07 = 0.238 + 23 =
Multiplying/Dividing • The answer cannot CONTAIN MORE SIGNIFICANT FIGURES THAN THE NUMBER BEING MULTIPLIED OR DIVIDED with the LEAST NUMBER OF SIGNIFICANT FIGURES. 100 x 203 = 245 / 403 = 0.0029 x 2.098 = 2.020 / 192 =
Temperature • Thermometer- instrument that measured how hot an object is • Celsius • Fahrenheit • Kelvin
°C = 5/9 (°F – 32°) • °F = 9/5 (°C) + 32° • K = °C + 273 • 99 °F = _____ °C • 20 °C = _____ °F • 1923 K = _____ °C • 45°C = _______ K
Presenting data Ch. 1.4
Organizing Data • Scientists collect data, and organize it by graphs, and tables • Communicate the data through journals and conferences • Line, bar, and circle
Line Graph • Show changes related to variables • Independent= X axis • Dependent= Y axis • Slope= rise/run Y / X • Directly Proportional • Ratio is constant • Inversely Proportional • Relationship in which the product of 2 variables is constant
Bar Graphs • Simple- • Width of bars must be the same • Grouped- • Each bar in a group needs a distinguished mark, with ledgend • Composite- • Each different component needs a distinguishing mark • Histogram- • Represents a range independent variables, rather than single value
Histogram Composite Grouped Simple
Circle/Pie Graph • Always = 100% • Key is needed • %= specific sample of data x 100 total data collected