Download
1 / 35
350 likes | 454 Views
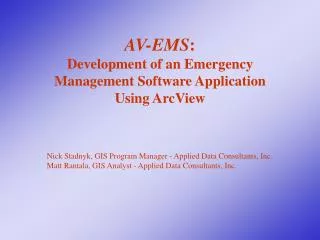
An ArcView GIS Application for Deriving Threshold Runoff Values to assist with Flash Flood Guidance. Seann M. Reed Research Hydrologist NWS-HRL Silver Spring, MD. TR. Outline. Definitions (ThreshR/FFG) Input data sets AV-ThreshR Software (Methods/GUI) Status/Future Plans. TR.

E N D
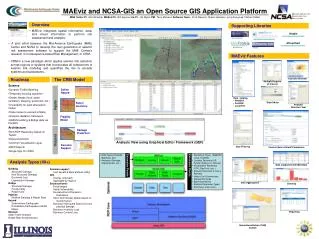
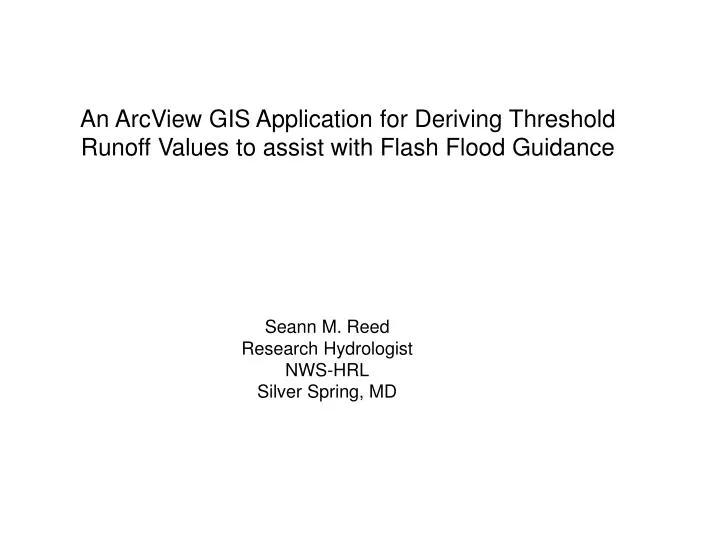
An ArcView GIS Application for Deriving Threshold Runoff Values to assist with Flash Flood Guidance Seann M. Reed Research Hydrologist NWS-HRL Silver Spring, MD
TR Outline • Definitions (ThreshR/FFG) • Input data sets • AV-ThreshR Software (Methods/GUI) • Status/Future Plans
TR What is AV-ThreshR? • A GIS database and tool set used to objectively derive • threshold runoff values. • Uses ArcView and Spatial Analyst with a customized GUI • Uses the same theory as the previous GRASS-ThreshR • with enhanced features: • delivered with a custom database • ArcView GUI • computes more than 30 different subbasin characteristics
TR What is threshold runoff? Threshold runoff (TR) = average runoff in inches over an area required to fill a channel TR = Qf/Qp Qf is the “flooding” or bankfull flow [cfs] Qp is the unit hydrograph peak flow [cfs/inch] Qf or “bankfull” flow
TR Estimators • Qf : Flooding FlowInputs not Available from GIS database • Manning’s Equation Bb, Db, Sc, n • Flood Frequency (e.g. Q2) inputs now available for each U.S. state • Qp : Unit Graph Peak Flow • Synthetic unit graph • Snyder’s UG Cp, Ct • Geomorphological UG Bb, Sc, n
TR Flash-Flood Guidance • Flash flood: “a flood which follows generally less • than 6 hours of heavy or excessive rainfall.” • Flash flood guidance: “average rain needed over • an area during a specified period of time to initiate • flooding on small streams” From NOAA Tech Memo NWS Hydro 44: “Modernized Areal Flash Flood Guidance”
TR How is threshold runoff used in FFG? Rainfall-runoff curve for current conditions in an RFC basin Runoff TR FFG Rainfall
TR Threshold Runoff : General Computational Steps • 1. Define “small” subbasins and compute subbasin parameters. • 2. Compute flooding flow (Qf), unit hydrograph peak flow (Qp), and threshold runoff for each subbasin of interest. • 3. Interpolate to the HRAP grid for the “gridded” flash-flood guidance option.
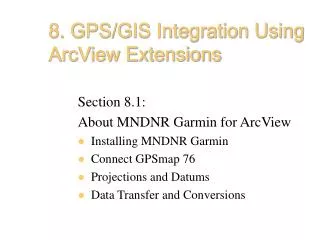
TR DEMs with National Coverage • Known Issues: • 15 arc-second DEM not accurate enough to resolve flash flood scale basins; 3 arc-second DEM may not be much better, esp. in areas of low relief • NED is the best available data -- now nationally available • Solutions: • NSSL national basin delineation using NED • NED-H
TR Example of Problem(s) with Coarser DEMs Enlarged Area RF3 (light blue) 3 arc-second (red) RF1 (dark blue) NED boundary 15 arc-second corrected with RF1 (gray)
TR Subbasin Delineation Methods b. Define stream reaches (links) a. Define stream cells d. Add headwaters of uniform size (optional) c. Define subbasins (catchment reaches) (9 subbasins) (14 subbasins 5 headwaters split)
TR B A Use Flood Frequency Equations to Approximate Qf USGS Water-Resources Investigations Report 94-4002, Jennings, M.E., Thomas, W.O., Jr., and Riggs, H.C., "Nationwide Summary of U.S. Geological Survey Regional Regression Equations for Estimating Magnitude and Frequency of Floods for Ungaged Sites, 1993," Reston, VA, 1994. • States may be divided into different regions (in the 50 U.S. states and Puerto Rico, there are 210 Regions) • Most (but not all) regression equations are of the form: • Qt = aXbYc . . . • Equations for Q2, Q5, Q10, Q25, Q50, and Q100 are typically available in each region; however, equations for certain return periods are not available in some regions. Hydrologic regions in Arkansas: Example: Q2B = 0.120A0.78S0.42(P-30)0.55E 0.75
TR GIS Database for Regression Equations In addition to basic topographic data sets, these layers are also required: 73 total
TR Unit Graph Peak Flow, Snyder Method tR tp=Ct*(L*Lc)^0.3 QpR tr=tp/5.5 Discharge tpR=tp-((tr-tR)/4) QpR=640*(Cp/tpR)*A tpR Time QpR = f(A, L, Lc, tpR, Ct, Cp)
TR AV-ThreshR Functions 1 2 3 4 5 6 7 8 9
TR 1. Setup
TR 2. Define Subbasins: Streamlink Method 5 Outputs from the this step
TR (subbasin) (stream) 3. Determine Connectivity • One arc per subbasin (common grid-code) • Stream arcs have a direction
TR Cumulative vs. Local Parameter Calculations Soil permeability example
TR 4. Compute Subbasin Parameters
TR (649 - 97) = 30.9 CHSL0 = 94386 4. Compute Subbasin Parameters
TR 4. Compute Subbasin Parameters Parcode Ftype Fwidth Fprecision Description Units Meastype Srcfile Srcdir Srctype Conversion
TR 4. Compute Subbasin Parameters Meastype attribute: Generic grid average and polygon average functions for local calculations.
TR 4. Compute Subbasin Parameters Which parameters must be computed for a given subbasin? Attribute Table for Statekey.shp
TR 5. Compute Q2, Q5 etc Arealevel Retperiod Special Numterms State Stateabbr Region Regionnum Terms Coeffs Ulimit
TR 5. Compute Q2, Q5 etc OK AR
TR 6. Unit Graph Peak Flow
TR 7. Subbasin Threshold Runoff
TR 8. Interpolate to HRAP GRID What does “gridded” flash-flood guidance mean?
TR Write FFG ASCII File FFG ASCII File (Dur) (hrapy) (hrapx) (ThR) . . . . . . . . . . . .
TR AV-ThreshR Status • AV-ThreshR Version 1 of programs is complete • Qx regression equation data layers delivered by MTU (Dec. 1999) • Flood frequency regression data and flow direction grids for ABRFC and MBRFC checked, corrected, and pre-processed (requires 2-3 days per RFC) • Draft documentation is online: • http://hsp.nws.noaa.gov/oh/hrl/gis/threshrhome.html Please send questions or comments to seann.reed@noaa.gov
TR Review of Main Points • AV-ThreshR Computational steps are modular so that • time intensive calculations are separated from quick calculations that may be repeated • users can look at subbasin parameter values in tables to understand where threshold runoff values come from • It is important to recognize database limitations. Database improvements are needed. • ThreshR is only one part of FFG -- the other major part is the underlying rainfall-runoff model.
TR Future Plans • Possible Database Improvements: • National database of unit graph coefficients (or regression equations to derive these coefficients). • Use basins and parameters derived from NED (NSSL work) • Update USGS flood frequency equations • Validation and feedback
TR Terrain/Network Database Size Estimates (ABRFC*) Input/Output Terrain Data** for Current System Required Data w/ Pre-computed Parameters (Retaining the Ability to Re-delineate Basins) Required Data w/ Pre-computed Parameters and No Opportunity to Re-delineate Basins * To approximate sizes for the largess RFC (MBRFC) multiply these values for ABRFC by a factor of 2.5. ** Does not include flood frequency layers. The size of these data layers will not change when using a higher resolution DEM.