Download
1 / 2
20 likes | 202 Views
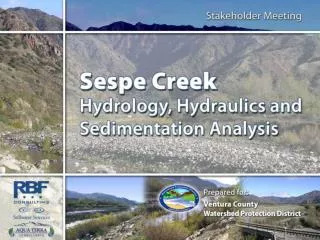
Hydrology Task: to be handed in 29.March . 2 Options one with more calulation effort (Matlab), the other with less effort (Excel). Area: Buschhagenniederung, a nature protection area near the North Sea in north western Germany. . ·.

E N D
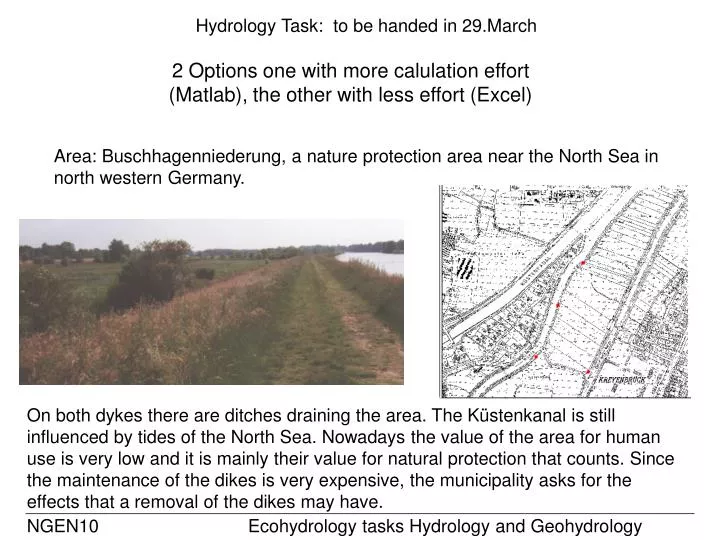
Hydrology Task: to be handed in 29.March 2 Options one with more calulation effort (Matlab), the other with less effort (Excel) Area: Buschhagenniederung, a nature protection area near the North Sea in north western Germany. · On both dykes there are ditches draining the area. The Küstenkanal is still influenced by tides of the North Sea. Nowadays the value of the area for human use is very low and it is mainly their value for natural protection that counts. Since the maintenance of the dikes is very expensive, the municipality asks for the effects that a removal of the dikes may have. NGEN10 Ecohydrology tasks Hydrology and Geohydrology
Hydrology Task: to be handed in Fr 12 .April 17:00 Sent as PDF via email. Veiko.lehsten@nateko.lu.se subject should contain NGEN10 Task 1: generate a map of the average groundwater level between two ditches. (A little bit higher calculation effort.) Task 2: for a scenario of complete dike removal, generate a map of average days of flooding per year. (less calculation effort) Data available: Excel sheet: Hydrology_data.xls DEM : Heights (an excel file with coordinates and heigths) Waterlevel: Hydrograph over two years Ditches: koordinates of ditches and their average water level Maps: TK5.tif raster map of the area as background for the final map? The final report shall contain the following: (basic rules for any report!) Name, course, task, method description, solution (maps and values and explanation of them), discussion (containing an estimation of errors of the results and suitability of the methods applied) NGEN10 Ecohydrology tasks Hydrology and Geohydrology