Download
1 / 102
1.06k likes | 1.28k Views
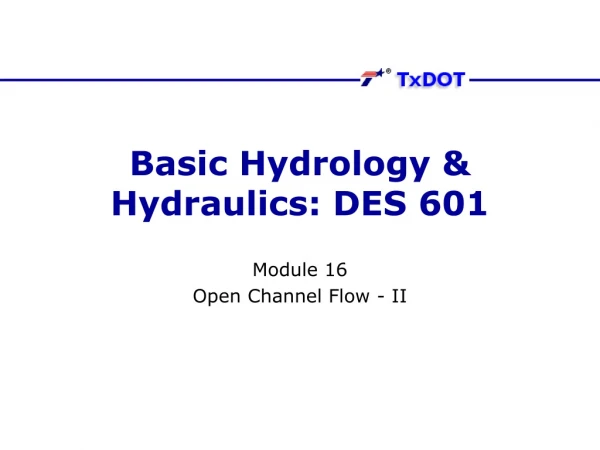
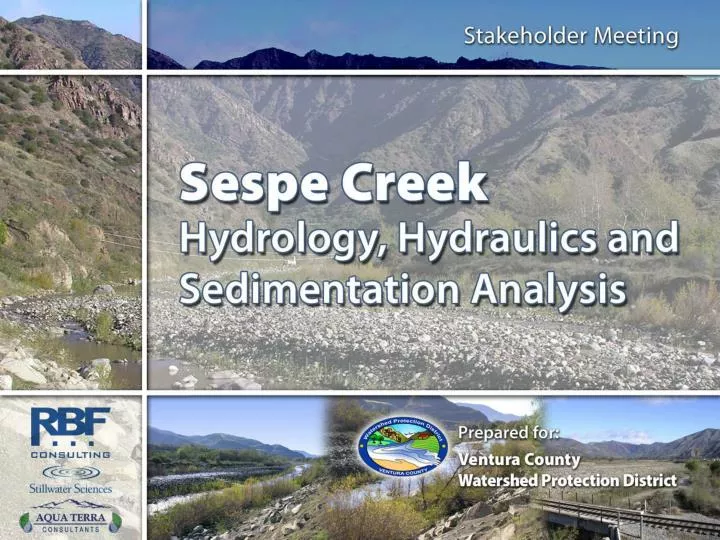
Sespe Creek Hydrology, Hydraulics and Sedimentation Analysis Presentation to the Technical Advisory Committee October 14, 2008. Sespe Creek Hydrology, Hydraulics and Sedimentation Analysis. The Project:

E N D
Sespe CreekHydrology, Hydraulics and Sedimentation AnalysisPresentation to theTechnical Advisory CommitteeOctober 14, 2008
Sespe CreekHydrology, Hydraulics and Sedimentation Analysis The Project: Development of a comprehensive re-evaluation of the Sespe Creek watershed to focus on identifying necessary improvements and maintenance needs to sustain the desired channel capacities of the lower Sespe Creek. Consultants: RBF Consulting – Engineering/Hydraulics/Sedimentation Stillwater Sciences – Geomorphology/Environmental Aqua Terra Consultants – Hydrology Timeline: January 2008 – March 2009
Sespe CreekHydrology, Hydraulics and Sedimentation Analysis The Project Scope: • Data Collection and Review • Field Reconnaissance • Hydrology Studies • Hydraulic Studies • River Morphology and Sedimentation Analysis • Flooding, Sedimentation, and Erosion Problem Identification and Alternative Solution Systems • Preliminary Environmental Impact Analysis • Progress/Stakeholder Meetings • Draft/Final Report and Deliverable
Sespe CreekHydrology, Hydraulics and Sedimentation Analysis Purpose of this meeting: • Discuss results of geomorphology and hydrology studies • Review approach for hydraulics/sedimentation analyses • Obtain Stakeholder feedback on studies and key issues in the watershed
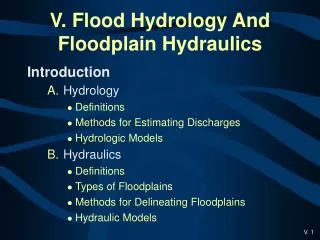
Sespe CreekHydrology, Hydraulics and Sedimentation Analysis Presentation Topics: • Watershed Assessment of Hillslope and River Geomorphic Processes • Hydrologic Modeling of the Sespe Creek Watershed • Future Hydraulics and Sedimentation Studies G E O M O R P H O L O G Y H Y D R O L O G Y H Y D R A U L I C S A N D S E D I M E N T A T I O N
G E O M O R P H O L O G Y Watershed Assessment of Hillslope and River Geomorphic Processes
G E O M O R P H O L O G Y Scope of Geomorphic Study • Assess the effects of the 2006 Day Fire on sediment yields and downstream channel morphology in the Sespe Creek watershed: • Research on fire history & sedimentation effects • Watershed-scale hillslope processes and sediment yields • River morphology
G E O M O R P H O L O G Y Scope of Geomorphic Study • Specific tasks: literature review, field reconnaissance, and GIS analysis. • Compile and review existing information relating to fire effects on sediment production in southern California watersheds, and hillslope and channel geomorphic processes • Characterize hillslope geomorphic processes in the watershed and resulting sediment yields into the mainstem Sespe Creek • Characterize sediment transport and channel dynamics in the mainstem of Sespe Creek to understand how these processes affect channel morphology, specifically in the lower reach adjacent to the Sespe Creek Levee
G E O M O R P H O L O G Y Presentation Outline • Watershed Characteristics • Fire History • Hillslope Processes • Coarse and Fine Sediment Production and Delivery • GLU Analysis • Pre-fire conditions • Post-fire conditions • River Morphology • Morphology and Sediment Character • Sediment Discharge • Morphologic Change in Lower Sespe Creek • Conclusions
G E O M O R P H O L O G Y Presentation Outline • Watershed Characteristics • Fire History • Hillslope Processes • Coarse and Fine Sediment Production and Delivery • GLU Analysis • Pre-fire conditions • Post-fire conditions • River Morphology • Morphology and Sediment Character • Sediment Discharge • Morphologic Change in Lower Sespe Creek • Conclusions
G E O M O R P H O L O G Y Topographic Map 2,290 m; 7,510 ft • Bullet Points Watershed Area = 674 km2 (260 mi2) Stream length = 97 km (60 mi) Relief = 105-2290 m (350-7500 ft) Unregulated flow and largely undeveloped Sespe Creek Levee
Eocene sandstone granitics Eocene shale Cretaceous sandstone Miocene shale Sespe sandstone G E O M O R P H O L O G Y Geologic Map • Bullet Points
Data Sources: Elevation: USGS 10m DEM; Watersheds: Stillwater Sciences; Cities, Road, Rivers, and Counties: ESRI; Precipitation: averages compiled by CDWR and CGS from US Weather Service Data supplemented by county and local agency precipitation. The data was collected over a sixty year period (1900-1960). Minimum mapping unit is 1000+ acres G E O M O R P H O L O G Y Geologic Map • Bullet Points ~2x change 36 cm 46 cm 57 cm 70 cm 83 cm 89 cm
G E O M O R P H O L O G Y Presentation Outline • Watershed Characteristics • Fire History • Hillslope Processes • Coarse and Fine Sediment Production and Delivery • GLU Analysis • Pre-fire conditions • Post-fire conditions • River Morphology • Morphology and Sediment Character • Sediment Discharge • Morphologic Change in Lower Sespe Creek • Conclusions
G E O M O R P H O L O G Y Day Fire – September 2006 • Bullet Points 1 per century 1 per 50 years 1 per 20 years
G E O M O R P H O L O G Y Day Fire – September 2006 Day Fire • Bullet Points Piru
G E O M O R P H O L O G Y Geomorphology Slides Day Fire – September 2006 • Bullet Points - USFS BAER
G E O M O R P H O L O G Y Presentation Outline • Watershed Characteristics • Fire History • Hillslope Processes • Coarse and Fine Sediment Production and Delivery • GLU Analysis • Pre-fire conditions • Post-fire conditions • River Morphology • Morphology and Sediment Character • Sediment Discharge • Morphologic Change in Lower Sespe Creek • Conclusions
G E O M O R P H O L O G Y 1 2 3 4 5 6 Sediment Production and Delivery- Tectonic Uplift Rates Middle Sespe Creek valley ~30 m modern river
Lower Sespe Creek valley: U San Cayatano fault D
Elevation (meters) Sespe Creek long profile Kilometers downvalley
Geologically determined uplift rates Sespe Creek watershed ~3 (west) to ~5 (east) mm/yr uplift 0.5 Santa Clara River watershed 2 Santa Paula Creek watershed 1-2 4 2-4 5 1-10 SOURCES: Rockwell 1988 Yeats 1988 Çemen, I. 1989 Lajoie et al. 1991 Huftile and Yeats 1995 Orme 1998 Trecker et al. 1998 Blythe et al. 2000 0.5 0.3 1
G E O M O R P H O L O G Y Sediment Production and Delivery Large volumes of fine sediment (silts and clays) are derived from highly erodible silt- and mudstones Coarse sediment (sand – boulders) are derived by rockfall from harder sandstones and granitic rocks in the Middle and Gorge subwatersheds Typical exposure of thin-bedded shale of the Cozy Dell Formation Sandstone bedding-plane surface of the Sespe Formation, east of the Sespe Creek gorge near the Dough Flat trailhead. Example of the delivery of coarse sediment blocks into the channel network from the weathering of a single sandstone interbed.
Controls on sediment production: • SLOPE • GEOLOGY • LAND COVER Slope categories (USGS 10-m DEM)
Geology categories (Mapping by Dibblee, 1970-1990)
Land cover categories (Landsat 30-m data)
G E O M O R P H O L O G Y Estimating sediment production: creation of GLUs Geomorphology Slides • Bullet Points
G E O M O R P H O L O G Y Watershed sediment yield—relative values “Low” “Medium” “High”
Watershed sediment yield—quantified values Waring Debris Basin
“High” ≈ 20,000 t km-2 a-1 “Medium” ≈ 2000 t km-2 a-1 Debris basin data from Ventura County used to quantify rates of sediment delivery Used for calculations: “Low” ≈ 300 t km-2 a-1
= location of monitored debris basin Sespe Creek Santa Paula Creek Five catchments with measured sediment-removal rates, showing GLU-derived levels (H, M or L) of sediment production.
Measured and predicted debris basin sediment yields <15-yr records; large basins 38-yr records; small basins Sediment yield (104 tonnes km-2 a-1) 100% 80 60 40 20 0 “Measured” values from Ventura County; “Calculated” values use presumed unit-area sediment-delivery factors (previous slide) (LH scale). Colored bars “H”, “M”, and “L” show proportional area (RH scale) in each category in the contributing watershed. Total watershed area (in km2) in parentheses.
G E O M O R P H O L O G Y Watershed Sediment Yield Total sediment production= 1,760 t km-2 a-1
Sespe Creek nr. mouth LowerSespeCreek
Calculated sediment load for Sespe Creek at Fillmore [USGS gage 11113000] 1645 t/km2/yr calculated from rating curve 1760 t/km2/yr predicted from GLU analysis Average yield = 1,109,000 t/yr (1645 t/km2/yr)
G E O M O R P H O L O G Y Coarse Sediment Yield Coarse sediment production – no connectivity impediments Granitics Granitics Sespe SS Sespe SS Matilija SS Matilija SS Cold-water SS Cold-water SS Sespe Gorge Fraction of coarse-grained litohologies on lower Sespe floodplain Fraction of coarse-grained litohologies, watershed-wide
G E O M O R P H O L O G Y Wildfire Effects on Sediment Production • Affects hydrologic and geomorphic processes of sediment production & delivery • Vegetation and runoff: burn-off increases dry ravel (loss of organic ‘check dams’), overland flow, rainsplash on bare surfaces • Soil structure: more friable, less cohesive, more water repellent (depends on fire severity, organic litter loss) • Rock weathering: fire decreases rock strength spalling (fragments) and fracture, especially in igneous rocks ~10 years Conceptualization of sediment yield and associated vegetation and litter recovery during the fire-induced ‘window of disturbance’ (based on Shakesby and Doerr 2006).
G E O M O R P H O L O G Y Wildfire Effects on Sediment Production Alternative approaches: • USFS BAER (Burned Area Emergency Response) method: based on Rowe et al. 1949 peak flows & debris basins yields in LA County • Scott and Williams 1978: storm-induced sediment yields, regression based on 1969 storm event, including “fire factor” • Geomorphic Landscape Units: GIS-based DEM analysis based on attributing yields to geology, slope, and land cover combinations source: Lave & Burbank 2003, based on LACFCD 1959 Log Sy = 1.244 + 0.828(log A) + 1.382(log ER) + 0.375(log SF) + 0.251(log FF) and 0.840(log K) Sy = Sediment Yield; A = area; ER = elongation ratio; SF = Area of soil failures; FF = fire factor [unveg * fire area]; K = storm factor (areas < 2.7 km2)
G E O M O R P H O L O G Y Observed Fire Impacts • Denuded vegetation cover • Dry ravel, rilling, and gullying
G E O M O R P H O L O G Y Observed Fire Impacts VCWPD rain gage • Denuded vegetation cover • Widespread rilling • Tributary debris fan deposits • Sand deposition in Lower Gorge pools • No evidence of post-fire landslides Tributary debris deposit delivery to Sespe Creek Sand accumulation
G E O M O R P H O L O G Y Wildfire Sediment Production • Watershed-wide predictions: • BAER (USFS 2006) - 6.1-fold increase (1,663 t km-2 a-1 to 10,188 t km-2 a-1) • GLU (this study) - 4.7-fold increase (1,760 t km-2 a-1 to 8,200 t km-2 a-1) • Scott and Williams (1978) - 3-fold increase based on max. possible increase in Fire Factor Predicted GLU-predicted fine-sediment production for pre-fire and post-fire (Day and Piru fires)
G E O M O R P H O L O G Y Transport dynamics of large sediment pulses pulses evolve, mostly by dispersion DISPERSAL – Where the pulse sediments are of similar size to downstream bed material: coarse sand and gravel TRANSLATION & ATTENUATION – Where the pulse sediments are finer than the downstream bed material: sand and finer (<2 mm) See: Lisle et al 2001; Cui et al 2003a, b; Cui and Parker 2005
G E O M O R P H O L O G Y Sediment Delivery - field evidence Upper half of the Sespe Gorge (2-5 m deep pools filled with sands in early 2008)
G E O M O R P H O L O G Y Presentation Outline • Watershed Characteristics • Fire History • Hillslope Processes • Coarse and Fine Sediment Production and Delivery • GLU Analysis • Pre-fire conditions • Post-fire conditions • River Morphology • Morphology and Sediment Character • Sediment Discharge • Morphologic Change in Lower Sespe Creek • Conclusions
G E O M O R P H O L O G Y River Morphology • Bullet Points