Download

1 / 62
740 likes | 1.03k Views
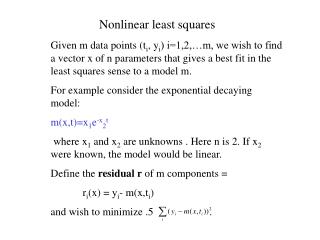
INTRODUCING LEAST SQUARES ADJUSTMENT TECHNIQUES FOR SURVEYING AND GEODESY. Joel van Cranenbroeck , Managing Director CGEOS CREATIVE GEOSENSING SPRL-S Rue du Tienne de Mont, 11 BE-5530 MONT – Belgium joel@creative-geosensing.com. « One measure is not a measure ».

E N D
INTRODUCING LEAST SQUARES ADJUSTMENT TECHNIQUES FOR SURVEYING AND GEODESY Joel van Cranenbroeck, Managing Director CGEOS CREATIVE GEOSENSING SPRL-S Rue du Tienne de Mont, 11 BE-5530 MONT – Belgium joel@creative-geosensing.com
« One measure is not a measure » • Good practice in surveying leads to perform more measurements than necessary ! Those extra measurements help to provide effective control on the results. • Distance measurements back and forward (traverse network) • Measuring the 3 angles of a triangle ( the sum must be 180 degrees) • Levelling loops (the sum must be zero) • Left and right side telescope measurements (to check the effect of small misalignments of mechanical components of a Total Station into the measurements) • Those “extra” measurements aim to : • Detect outliers in the observations (gross errors) • Check other measurements. • Provide consolidated results (best estimate) • Judge of QUALITY = Precision + Reliability
From multiple measurements to an unique result (best linear unbiased estimator) What series has the more “precise” measurement ? How will you consider a new 10th measurement ? What will be your criteria to accept or deny ?
Design, Quality Control and Analysis of Surveying Measurements … • Statistical inference is essential to get a better understanding into the survey measurements. Statistic and Probability are as older as geodesy and surveying. • More and more even, statistical analysis is the only way to provide results such for GNSS where Least Squares Adjustment is playing a fundamental role to achieve high accuracte performances.
True Value, Precision and Accuracy …Frequency distribution of 1 min. GPS data
True Value, Precision and Accuracy …Frequency distribution of 1 hour GPS data
True Value, Precision and Accuracy …Frequency distribution of 12 hours of GPS data
From multiple measurements to an unique result (best linear unbiased estimator) • LEGENDRE invented the Least Squares Adjustment Method for determining the planet’s orbits. • GAUSS provided the mathematical basis and rigorous formulation. • LAPLACE, TCHEBYCHEV et MARKOV contributed with much developments. • The geodesists DOOLITTLE, HELMERT, TIENSTRA, MEISSL et MORITZ performed important work to apply that method in geodesy. • CHOLESKY, BANACHIEWICZ, GAUSS et JORDAN invented algorithms to solve challenges especially in numerical analysis (linear equations).
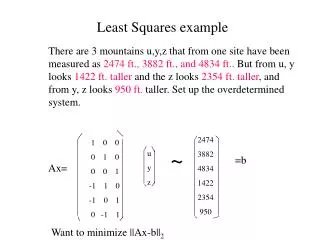
Let’s start with a levelling network • We want to determine the altitude (orthometric height) of B and C knowing the altitude of A and using levelling technique : • HA = 124.180 m. • Observations : dh1 = + 6.14 dh2 = + 8.34 dh3 = - 14.48 dh4 = - 8.35 dh5 = - 6.16
Observation EquationFunctional (Mathematical) Model • We can write for each observation an equation which describe the relationship between the point’s altitude : HA + dh1 = HB HB + dh2 = HC HC + dh3 = HA HC + dh4 = HB HB + dh5 = HA
Observation EquationFunctional (Mathematical) Model • The « unknowns » are written at the left hand side and we introduce the corrections (also named residuals) «vi » : HB = HA + dh1 + v1 HB - HC = -dh2 + v2 HC = HA - dh3 + v3 HC - HB = -dh4 + v4 HB = HA - dh5 + v5
Observation EquationFunctional (Mathematical) Model • In matrix notation, we can write the functional model : Design matrix Observations Residuals/Corrections Unknown/parameters
Observation EquationFunctional (Mathematical) Model • We obtain an « over-determined » linear equation system ( n > m ) : • « n » observation equations, here n = 5 • « m » unknowns/parameters ( the orthometric height of B and C ), here m = 2 • To obtain a solution we must impose a « condition » on the corrections. • To minimalise the sum of the squared residuals is the « Least Squares Adjustment Principle » named Minimum Norm L2 … but we can also minimalise the sum of the absolute value of the residuals which is the basis of a « Robust » adjustment based on the Minimum Norm L1 L1 norm L2 norm
Least Squares Adjustment Solution • The solution is obtained by applying the Least Squares principles on the functional model that can be written in matrix notations such : • The squared corrections (Least Squares) is obtained :
Least Squares Adjustment Solution • Let’s start developping :
Least Squares Adjustment Solution • We obtain easily : • And as : • First derivative :
Least Squares Adjustment Solution To « minimise » that result, one need to set the first derivative to zero, then : We get the following solution : Assuming that is positive definite !
Back to the levelling network … • The Normal Matrix N and its inverse :
Back to the levelling network … • The solution is given by :
Adjusted observations and corrections … • The adjusted observations are obtained by : • The corrections by :
The Adjustment’s results for B and C • B = 130.326 m. • C = 138.667 m. • A = 124.180 m. • Corrections : v1 = + 0.006 v2 = + 0.001 v3 = - 0.007 v4 = + 0.009 v5 = + 0.014
The Stochastical Model … • The idea is to integrate the information about the accuracy of the measurements - a priori. • One can speak about an entire definite stochastical model by the standard deviation of the observations estimated a priori. • That means we have to take into account all the factors … and not only the manufacturer specification ! • For a Hz direction for instance : • The standard deviation of the Hz measurement • The centrering error of the instrument • The centrering error of the target • etc. • The variance-covariance matrix of the observations is built with all that information …
The Stochastical Model … • That matrix is defined by the cofactor matrix and the variance factor. That is the variance factor of the weight unit …
The Stochastical Model … • The inverse matrix of the variance-covariance matrix is named « weight matrix ». • The function to minimize becomes : • With the solution :
The « a posteriori » qualityindicators are defined … • Those are the variance-covraiance matrices scaled by the variance factor « a posteriori ». • Variance factor : • variance-covariance matrix of the parameters : • variance-covariance matrix of the adjusted observations : • Matrice variance-covariance des corrections :
Back to the levelling network … • Estimation of the variance factor « a posteriori » often named empirical variance factor : • Remember we selected the a priori variance factor to 1 cm !
Back to the levelling network … • Variance-covariance matrix of the parameters : • The standard deviation of the parameters are :
Quality of the results … still some questions … Now we have all the information that is needed to « judge » of the quality results … What if we had choosen another point then A ? Is it necessary to fix a point ?
Back to the levelling network … • Variance-covariance matrix of the observations :
Back to the levelling network … • Variance-covariance matrix of the observations :
Back to the levelling network … • Variance-covariance matrix of the corrections :
Redundancy, degree of freedom … • The degree of freedom « r » isdefined as the differencebetween the number of observation and the number of parameter : • The trace of the matrix isegal to the degree of freedom « r » :
Redundancy, degree of freedom … • Each diagonal element of that matrix is expressing an important information about how each observation is contributing the the total redundancy of the system … • We consider the following criteria : not controlled observation badly controlled observation controlled observation well controlled observation
Back to the levelling network … • Local redundancy factor « r » : r1 = 0.625 r2 = 0.625 r3 = 0.500 r4 = 0.625 r5 = 0.625 • We have pretty well controlled observations …
From a Levelling Network up to GPS Network …The functional models are similar … • A = R + b1 • B = R + b2 • C = R + b3 • D = R + b4 • B - F = b5 • C – F = b6 • D - F = b7 • E - F = b8 • A - D = b9 • B - D = b10 • C - D = b11 • E - D = b12 R b1 A b2 b3 B b4 b10 b9 b11 C D b5 b6 b7 b12 F E b8
From a Levelling Network up to GPS Network …The functional models are similar … R b1 A b2 B b3 b4 b10 b9 b11 C D b5 b6 b7 b12 F E b8
How to model a simple Levelling line ? Setup the equations for each observation Build the functional model and derive the Least Squares Adjustment solution without considering any observation (simulation). What would be the “reliability” ? R D1 A B C D2 D3 D4 D D5 E F D6
How to model a simple Levelling line ? Setup the equations for each observation Build the functional model and derive the Least Squares Adjustment solution without considering any observation (simulation). What would be the “reliability” ? R D1 A B C D2 D3 D4 D D5 E F D6
In geodesy and surveying we have also directions ( Hz , Vz ) and distances … • Like for the levelling network we have to write the “functions” to setup the equations … • But the Least Squares Adjustment method is dealing with linear equations (non linear Least Squares is dealing with non linear functions but it’s out of our scope) • So with have to “linearized” the functions we are using by applying a decomposition in series of Taylor limited to the first order (because that’s the linear part…) around an approximated value.
Gl0 l0 Direction HZ : B lAB A
Least Squares Adjustment We find exactly the same adjusted coordinates than with Leica GeoMoS !
How about a Traverse ? S R A B C F