Download
1 / 13
160 likes | 302 Views
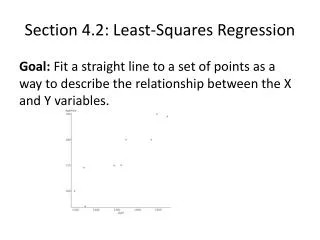
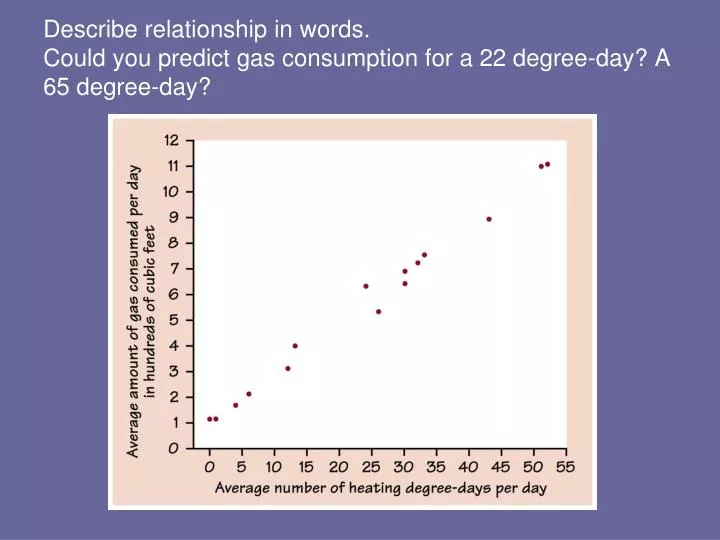
Describe relationship in words. Could you predict gas consumption for a 22 degree-day? A 65 degree-day?. Least Squares Regression. Section 3.3 (First Part). Regression Line. Describes how response variable y changes as explanatory variable x changes. Used to make predictions.

E N D
Describe relationship in words. Could you predict gas consumption for a 22 degree-day? A 65 degree-day?
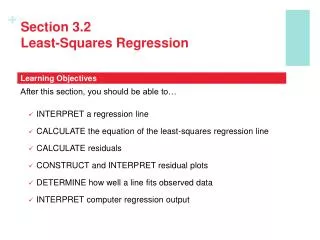
Least Squares Regression Section 3.3 (First Part)
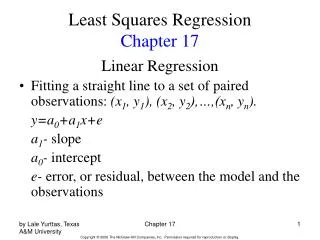
Regression Line • Describes how response variable y changes as explanatory variable x changes. • Used to make predictions. • Least Squares Regression Line (LSRL) is a mathematical model for data. • Makes the sum of the squares of the vertical distances from each data point to the line as small as possible. • Equation: ŷ = a + bx “y hat” Predicted value Intercept a = y - bx Slope b = r (sy/sx)
Least Squares Regression Facts • Looks only at distance in y-direction. • x must be explanatory variable and y must be response variable. • Correlation just measures relationship (doesn’t matter which is response or explanatory variable)
Mean y = ? Mean x = ?
Correlation and Regression Applet http://bcs.whfreeman.com/ips5e/pages/bcs-main.asp?v=category&s=00010&n=99000&i=99010.01&o=|00510|00520|00530|00540|00550|00560|00570|00590|00PRS|00580|00600|00010|00020|00030|00040|00050|00060|00070|00080|00110|00090|00100|00120|00130|01000|02000|03000|040
LSRL for Sanchez Family • Steps: (Data p.115) • x values in L1 • y values in L2 • STAT, CALC, LinReg (a + bx) L1, L2, Y1 • a= intercept, b=slope • y1= 1.0892 + .1890x
Coefficient of Determination: r2 • Percent of the variation in the values of y that are explained by least-squares regression of y on x. • Tells how successful the regression was in explaining the response. • Example: r = ±1, r2 = 1; 100% of response is explained by LSRL. • If r = ±.8, r2 = .64; 64% of response is explained by LSRL.