Download
1 / 30
330 likes | 593 Views
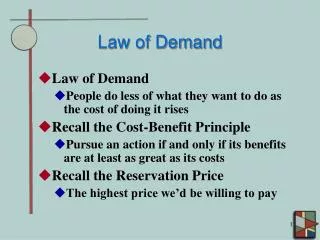
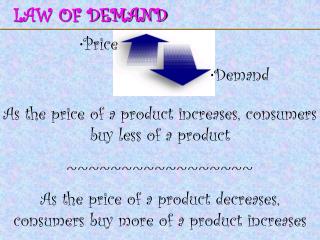
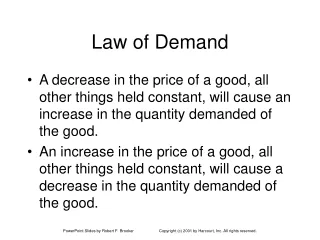
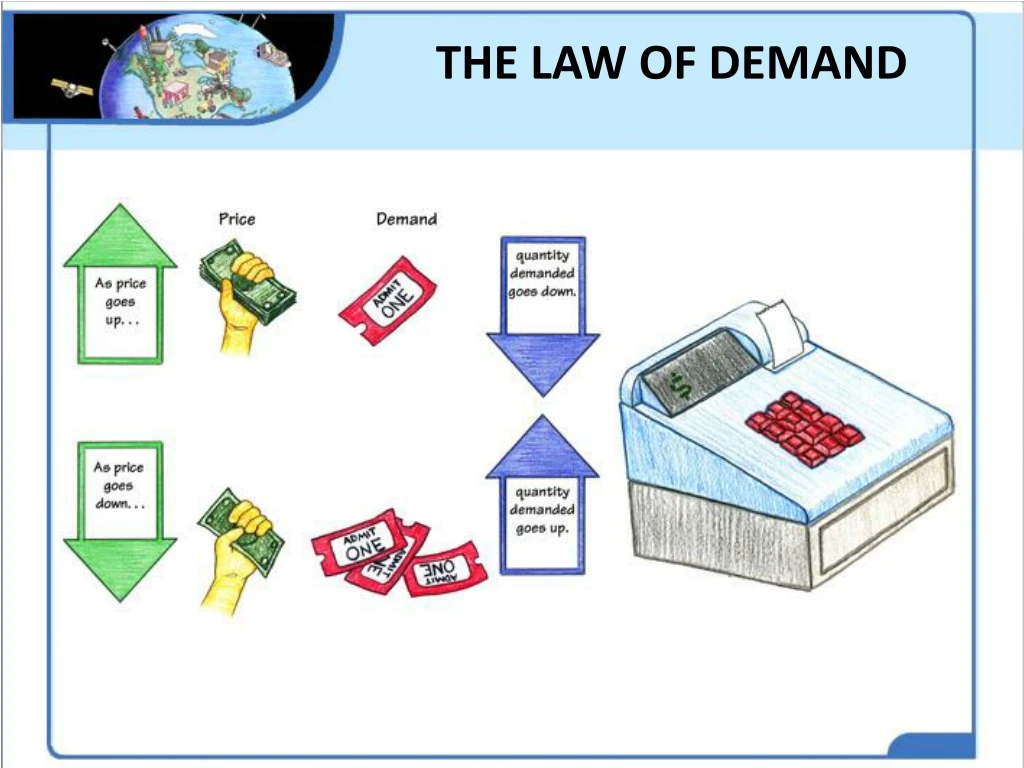
THE LAW OF DEMAND. THE LAW OF DEMAND. The quantity demanded is the amount of a good that consumers are willing and able to purchase at a particular price over a given period of time.

E N D
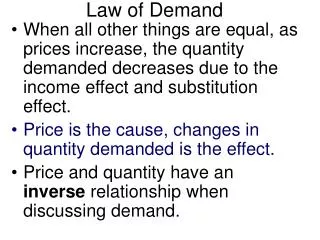
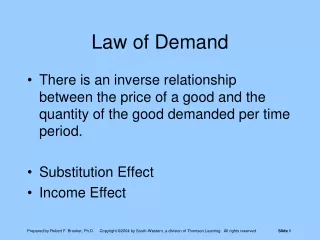
THE LAW OF DEMAND The quantity demanded is the amount of a good that consumers are willing and able to purchase at a particular price over a given period of time. There are two distinct reasons why a consumer buys less of a good after its price increases: the substitution effect and the income effect. The substitution effect arises when an increase in the price of a good causes a consumer to switch away from that good and toward other goods that do not experience a price increase. Likewise, a decrease in the price of a good causes consumers to switch toward that good.
THE LAW OF DEMAND The quantity demanded is the amount of a good that consumers are willing and able to purchase at a particular price over a given period of time. There are two distinct reasons why a consumer buys less of a good after its price increases: the substitution effect and the income effect. The income effect is the change in consumption that occurs when a price increase causes consumers to feel poorer or when a price decrease causes them to feel richer.
THE LAW OF DEMAND AND THE “ALL ELSE EQUAL” ASSUMPTION Economists use the Latin term ceteris paribus, meaning “all else equal,” to indicate that they are looking only at a specified relationship, such as the one between price and quantity demanded.
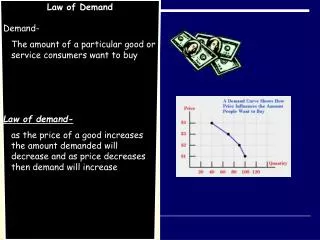
THE DEMAND SCHEDULE & THE DEMAND CURVE A demand schedule is a table that relates the quantity demanded of a particular good to its price.
INDIVIDUAL DEMAND SCHEDULE & THE DEMAND CURVE A demand curve is a graphical representation of the demand schedule for a good, showing the quantity demanded at each price.
THE DEMAND SCHEDULE & THE DEMAND CURVE The market demand curve for a good is a graphical representation of how the quantity demanded by ALL consumers in the market varies with the price.
THE DEMAND SCHEDULE & THE DEMAND CURVE The market demand curve for a good is a graphical representation of how the quantity demanded by ALL consumers in the market varies with the price.
THE DEMAND SCHEDULE & THE DEMAND CURVE The market demand curve for a good is a graphical representation of how the quantity demanded by all consumers in the market varies with the price.
MOVEMENTS ALONG ADEMAND CURVE A movement along a demand curve caused by a price change is called a change in the quantity demanded, not to be confused with a change in demand.
SHIFTS OF THE DEMAND CURVE A shift of the demand curve represents a change in the amount people are willing and able to buy at every price.
SHIFTS OF THE DEMAND CURVE
SHIFTS OF THE DEMAND CURVE
WHAT CAUSES THE DEMAND CURVE TO SHIFT? All of the following shift the demand curve: • Tastes and preferences • More popular demand shifts right • Income (if income increases) - normal good (the demand shifts right) - inferior good (the demand shifts left) If more people demand a good, the price will increase.
WHAT CAUSES THE DEMAND CURVE TO SHIFT? All of the following shift the demand curve: • Tastes and preferences • Income - normal good - inferior good The Prices of Related Goods (if the price increases) - substitute goods (demand will increase) - complementary goods (demand will decrease)
WHAT CAUSES THE DEMAND CURVE TO SHIFT? All of the following shift the demand curve: • Tastes and preferences • Income - normal good - inferior good • The Prices of Related Goods - substitute goods - complementary goods • Expectations (a predicted shortage will increase demand)
WHAT CAUSES THE DEMAND CURVE TO SHIFT? All of the following shift the demand curve: • Tastes and preferences (more popular demand shifts right) • Income (if income increases) - normal good (the demand shifts right) - inferior good (the demand shifts left) • The Prices of Related Goods (if the price increases) - substitute goods (demand will increase) - complementary goods (demand will decrease) • Expectations (a predicted shortage will increase demand) • The Number of Buyers (more buyers increases demand)
WHAT IS ELASTICITY? Elasticity of demand is a measure of how strongly consumers respondto a change in the price of a good, calculated as the percentage change in the quantity demanded divided by the percentage change in price. • Demand is elastic if consumers respond to a change in PRICE with a relatively large change in the quantity demanded • Demand is inelastic if consumers respond to a change in PRICE with a relatively small change in the quantity demanded. • Demand is unit-elastic if consumers respond to a change in price by changing the quantity demanded by the same percentage.
WHAT MAKES DEMAND MORE OR LESS ELASTIC? • Necessities versus luxuries: If you need it, your demand is relatively inelastic. • The availability of close substitutes: No substitutes means your demand is inelastic. • The share of income spent on the good: If It is a large expense, your demand is elastic. • Time: If you can wait, your demand is elastic.
COMPARING ELASTICITIES By calculating the value of elasticity, economists can categorize the demand for goods according to how sensitive consumers are to price changes. We can specify whether demand is elastic, inelastic, or unit elastic, depending on the value of elasticity. The larger the elasticity, the greater the percentage change in quantity demanded relative to the percentage change in price and the stronger the response to a price change.
ELASTICITY, TOTAL SPENDING, & TOTAL REVENUE Total revenue is all the money consumers spend on a good, and firms receive for a good, during a particularperiod of time: it is the price of the good multiplied by the quantity of the good sold. Changes in Total Revenue with Elastic Demand Price increases = total revenue decreases Price decreases = total revenue increases
ELASTICITY, TOTAL SPENDING, & TOTAL REVENUE Total revenue is all the money consumers spend on a good, and firms receive for a good, during a particularperiod of time: it is the price of the good multiplied by the quantity of the good sold. Changes in Total Revenue with Inelastic Demand Price increases = total revenue increases Price decreases = total revenue decreases
ELASTICITY, TOTAL SPENDING, & TOTAL REVENUE Total revenue is all the money consumers spend on a good, and firms receive for a good, during a particularperiod of time: it is the price of the good multiplied by the quantity of the good sold. Constant Total Revenue with Unit-Elastic Demand Price increases or decreases = total revenue unchanged.
ELASTICITY, TOTAL SPENDING, & TOTAL REVENUE Changes in Total Revenue with Elastic Demand Changes in Total Revenue with Inelastic Demand Constant Total Revenue with Unit- Elastic Demand