Download
1 / 16
160 likes | 178 Views
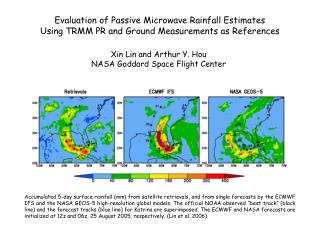
This paper discusses the development of a level 1C inter-calibrated microwave radiance product for use in rainfall estimation. The aim is to overcome political and programmatic issues and provide calibrated data to the rainfall community. The paper outlines the inter-calibration procedure and quality control procedures used. The availability of rainfall maps based on the inter-calibrated data is also mentioned.

E N D
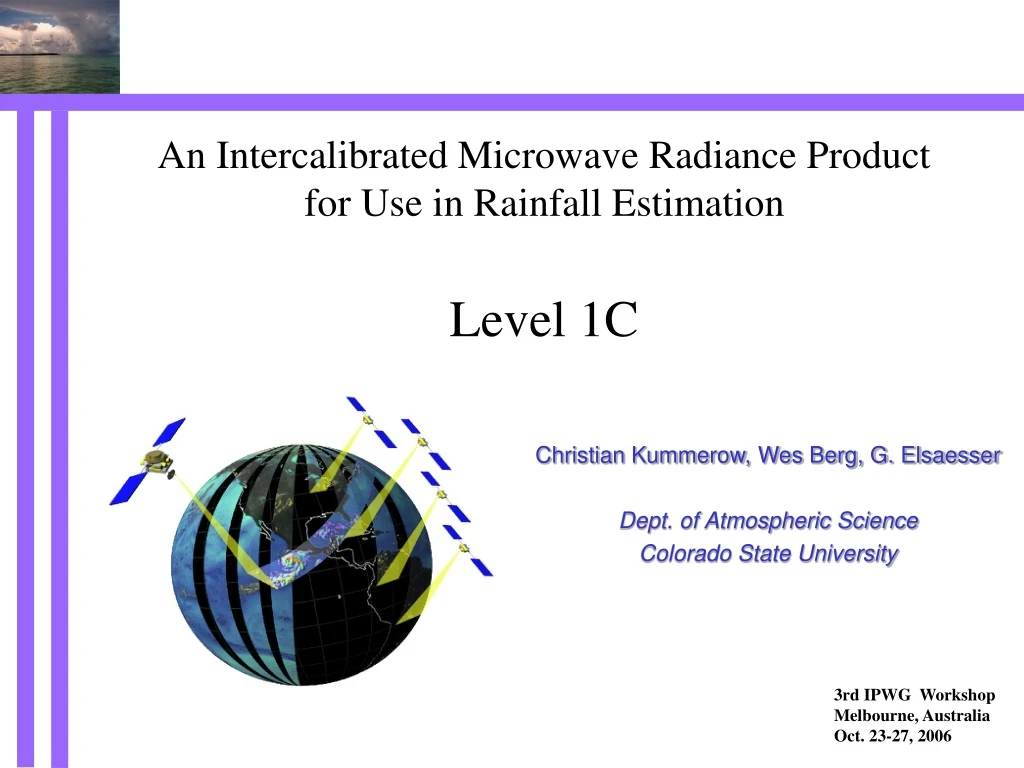
An Intercalibrated Microwave Radiance Product for Use in Rainfall EstimationLevel 1C Christian Kummerow, Wes Berg, G. Elsaesser Dept. of Atmospheric Science Colorado State University 3rd IPWG Workshop Melbourne, Australia Oct. 23-27, 2006
Original Motivation GPM will fly a constellation of radiometers to provide ~3-hourly sampling. If the radiometers are not inter-calibrated, neither will the rain rates. Except for the dedicated GPM radiometers (GMI), the remaining set belongs to US and International agencies that have differing experience and requirements for calibration. These agencies may or may not support calibration activities once their own requirements are met. Level 1C is an attempt to overcome political and programmatic issues and return “calibration” and data stewardship to the rainfall community Level 1C aims to simplify formats and toolkits. “If a graduate student knows how to read data from one sensor, they can read it from all sensors”
Chan Freq (GHz) *V-Pol only **H-Pol only ***V, H, +/45º, L, R Today’s GPM constellation Inc Ang Sensor
Inter-calibration Procedure • Select coincident overpasses (±30 min.) of TMI and SSM/I (other sensors will be done in same fashion but waiting for next version of algorithm below) • Use current retrieval method (OE in non-raining + PR adjustment in rain) to derive geophysical parameter field that is consistent with each TMI Tb • Use geophysical parameters to compute Tb for each SSM/I sensor using appropriate channels, view angles and spatial resolution • Compute biases in computed SSM/I Tb versus observed Tb. • Use as much data as possible to reduce random errors.
Simulated TBs vs Observed TBs 19 H (K) 21 V (K) 180 265 160 245 Simulated Simulated 140 225 120 205 120 140 160 180 205 225 245 265 TMI TMI 85 V (K) 37 H (K) 195 300 175 280 Simulated Simulated 155 260 135 240 135 155 175 195 240 260 280 300 TMI TMI
Level 1C Calibration Differences TB Bias (Simulated Minus Observed) in Kelvins +3 +2 +1 0 -1 -2 TMI SSM/I F13 SSM/I F14 SSM/I F15 AMSR-E 19 H 19 V 22 V 37 H 37 V 86 H 86 V Approximate Channel Frequency
Level 1C development Quality Control Procedures • Pixel check for nonphysical values: Checks that individual antenna temperatures values are within physical limits (currently 50 to 325K), that lat/lon values are within range (-90 to 90 and -180 to 360), and that the distance between pixels along a scan are reasonable (10 to 30km). • Scan check for nonphysical seperation: Checks that the distance between adjacent scans (nadir point) is between 20 and 30 km. Scans outside of this range are flagged and are currently eliminated (not written out). • Scan check for deviations from climatology: Compares the antenna temperatures for each channel along the scan to climatological values. If more than 30% of the pixels along a given scan are greater outside the range of the mean climatological TA +/- 3 sigma, and this represents a change of 30% or more from the prior scan, the scan is flagged and eliminated (not written out).
Naming Convention F11.1C.CALT1.R1.19990303.37470.HDF T : TMI was used as reference standard 1 : Maturity level 0: Nothing has been done to calibrate the Tb to the reference sensor 1: Data has been re-calibrated to match the reference instrument 2: The intercalibration has been verified by at least one independent effort 3: The intercalibration has been accepted by the Precipitation Science Team R : Revision number 1 : Initial Version R2, R3 etc.) indicate substantive changes to the data, data format, and/or file contents, which imply reprocessing of the entire data record. Minor revisions to the files, such as might occur with a change to the metadata, are indicated by a lower case letter following the revision number (i.e. 1a, 1b, etc.).