Download
1 / 21
220 likes | 387 Views
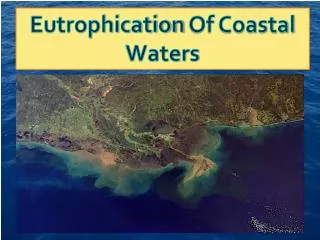
Eutrophication Assessment in Coastal Waters A Decade of Change. S.B. Bricker National Oceanic and Atmospheric Administration Silver Spring, MD, USA. New Jersey Water Quality Monitoring Council Meeting September 6, 2007 NJDEP HQ – Public Hearing Room, Trenton, NJ. http://www.eutro.org.

E N D
Eutrophication Assessment in Coastal WatersA Decade of Change S.B. Bricker National Oceanic and Atmospheric Administration Silver Spring, MD, USA New Jersey Water Quality Monitoring Council Meeting September 6, 2007 NJDEP HQ – Public Hearing Room, Trenton, NJ http://www.eutro.org http://www.eutro.us
The Context and Guiding Legislation • US Clean Water Act of 1972, US Harmful Algal Bloom and Hypoxia Research and Control Act of 1998 • EU Water Framework Directive (2000/60/EC), EU UWWTD and Nitrates Directives – Definition of Sensitive Areas and Vulnerable Zones • Eutrophication is a significant problem worldwide (US, EU, Baltic, Mediterranean, Japan, Australia and elsewhere) http://www.eutro.org http:;//www.eutro.us http://ian.umces.edu/neea
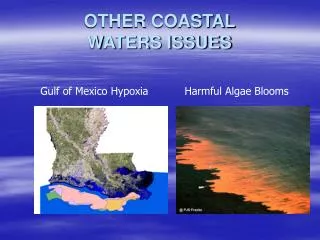
Symptoms and Consequences of Nutrient Enrichment Nutrient Inputs Primary Secondary Consequences and Processing Impacts Impacts of Symptoms High algal production (Chl) Loss of water clarity Epiphyte problems Macroalgal problems Fish kills Loss of habitat Human health risks Loss of tourism Closed fishing grounds Increased N and P concentration Loss of SAV Low D.O Nuisance/Toxic blooms (HABs) The Problem – The Assessment Approach NEEA/ASSETS: Pressure - State - Response P: Influencing Factors – Natural processing + Human Nutrient Load S: Overall Eutrophic Condition – Condition of waterbody R: Future Outlook – What will happen in the future? http://www.eutro.orghttp://ian.umces.edu/neeahttp://www.eutro.us
Key Aspects of NEEA/ASSETS approach • The NEEA approach may be divided into three parts: • Division of estuaries into homogeneous areas • Evaluation of data completeness and reliability • Application of indices • Tidal freshwater (<0.5 psu) • Mixing zone (0.5-25 psu) • Seawater zone (>25 psu) Spatial and temporal quality of datasets (completeness) Confidence in results (sampling and analytical reliability) State:Overall Eutrophic Condition index (Chl, macroalgae, HABs, DO, SAV loss) Pressure: Overall Human Influence index (susceptibility + nutrient load) Response: Future Outlook index (susceptibility + future nutrient load) Guide for management, research, monitoring
Overall Human Influence Moderate High High Moderate High Susceptibility Moderate Low Moderate High Moderate Moderate Moderate Low Low Low Low Low Moderate High Nutrient Pressures Pressure: Influencing Factors Susceptibility + Nutrient Inputs = Overall Human Influence dilution & flushingland based or oceanic
State: Overall Eutrophic Condition Overall Eutrophic Condition Moderate High High Moderate High Primary Symptoms Moderate Low High Moderate Moderate Moderate High Low Moderate Low Low Low Moderate High Secondary Symptoms
Future Outlook For Eutrophic Conditions Improve High No Change Worsen Low Low Susceptibility No Change Improve Low Worsen High Moderate No Change Worsen High Improve Low High Decrease No Change Increase Future Nutrient Pressures Response: Future Outlook Future outlook is based on susceptibility and projected changes in nutrient pressures: Susceptibility is the capacity of a system to dilute or flush nutrients Nutrient pressure changes are based on expected population changes, future treatment and remediation plans and changes in watershed use (particularly agricultural)
Influencing Factors RegionHuman InfluencePrimary (No. systems) (M – H) >50% NPS NPS from Ag*No. Atlantic (18) 33 78 0 Mid Atlantic (22) 100 91 60 So. Atlantic (22) 81 100 81 Gulf of Mexico (38) 95 100 85 Pacific (39) 82 89 50 US Total (139)** 68 92 56 Portugal (10) 30 89 67 China (4) 75 ? ? as percentage of systems US from SPARROW model estimates, PT from Ferreira et al 2003 *for US: >30% though most are >70% from ag, for PT: ag is most significant nonpt source * *Early 2000s: 44 of 64 (~70%) systems evaluated had moderate to high influencing factors
Minho ? Lima ? Douro ? Ria de Aveiro ? Mondego Spain Tagus Sado Mira Guadiana Ria Formosa China Unknown ? Moderate High Moderate Low Moderate High Low http://ian.umces.edu/neea http://www.eutro.us Overall Eutrophic Condition 1990s – 84 of 121 assessed systems M to H 17 systems unknown 2000s – 64 of 99 assessed systems M to H 42 systems unknown
Minho ? Lima Douro Ria de Aveiro Mondego ? Spain Tagus Sado Mira Unknown ? Guadiana No Change China Ria Formosa Worsen Low Worsen High Improve High Improve Low http://ian.umces.edu/neea http’//www.eutro.us Future Outlook 1990s – 71% assessed systems – worsen 7% assessed systems - improve 2000s – 65% assessed systems – worsen 20% assessed systems - improve
ASSETS Synthesis US US EU CN 1990s 2000s High 2 1 2 1 Good 19 5 2 1 Moderate 28 18 2 Poor 53 11 1 Bad 18 13 1 Unknown 19 93 4 Management
Changes 1990s – 2000s Analysis was possible for 58 of 141 systems Improved: 13 systems (9%) assessed surface area Worsened: 13 systems (14%) assessed area Remained the same: 32 systems (77% assessed area) Due to management efforts, primarily point source Due to population increase and associated activities
% assessed systems with Moderate & High symptom expression Mid Atlantic Region 1999 2004 % change HABs 50 63 13 Chl a 100 86 14 Mid Atlantic Lagoon Systems
Minho Lima Douro Ria de Aveiro Mondego Spain Tagus Sado Mira Guadiana Ria Formosa Typology: DISCO Cluster Results Classification based on physical and hydrologic characteristics – nutrients will be processed differently in systems that flush well or flush poorly and management strategies will be different A top-down classification resulted in 14 types. DISCO gives 10 types. A top-down classification resulted in 7 types. DISCO gives 6 types but semi-enclosed lagoons were not included
Results – ASSETS model WFD Farm Dimensions (m) Species Cultivation (d) 300X20X10 Generic 45 Food Chl a (mg L-1) POM (mg L-1) TPM (mg L-1) 11 5 25 Environment Current (m s-1) T (o C) O2 (mg L-1) 0.02 15 7.0 Cultivation scenario Low MediumHigh Density (ind m-3) 25 100 500 Total seed (X103 ind) 1500 6000 30000 Total harvest (ton TFW) 13.1 36.8 39.1 Final mean Chl a (mg L-1) 9.5 6.0 1.3 Final min. O2 (mg L-1) 5.9 3.8 1.8 ASSETS grade GoodModerate Poor Income (k€) 65.5 184 195 Ferreira, Hawkins and Bricker. 2007 Aquaculture 264:160-174
Shellfish farming: 2300 k€ y-1 Sewage treatment: 2000 k€ y-1 Total income: 4300 k€ y-1 Chl a O2 Eutrophication control 富营养化控制 Phytoplankton removal 31000 kg C y-1 Shellfish ffiltration Detritus removal 84540 kg C y-1 N removal (kg y-1) Algae -4822 POM -13151 Excretion 3745 Faeces 3545 Mass balance -10683 Population equivalents 3237 PEQ y-1 ASSETS INCOME PARAMETERS Density of 500 oysters m-3 180 day cultivation period 11 mg L-1 chl a initial 3.3 kg N y-1 PEQ
National and International Partners Thank You!
Chincoteague Ria de Aveiro Ria Formosa MD Coastal ASSETS: BAD ASSETS: MOD ASSETS: Four Lagoonal Systems ASSETS: BAD ASSETS: GOOD Indices Overall Human Influence (OHI) Overall Eutrophic Condition (OEC) Determination of Future Outlook (DFO) MODERATE MODERATE LOW IMPROVE LOW MODERATEHIGH HIGH IMPROVE LOW MODERATE HIGH IMPROVE LOW MODERATELOW MODERATE NO CHANGE Population (X 103) 19-171 12-108 250-300 124-211 Nutrient loading (tN y-1) 550 913 2760 1028 Mean depth (m) 1.1 1.2 1.4 1.9 Mean tidal range (m) 0.7 0.5 2 2 Water res. time (days) 253 183 4 0.5-2 Main impacts Chlorophyll a HABs SAV loss Macroalgae HABs Macroalgae Red tides Intertidal O2 MacroalgaeBivalve mortality
Pressure: Influencing Factors • mh, expected nutrient concentration from land based sources (i.e. no ocean sources); • mb, expected background nutrient concentration from ocean (i.e. no land-based sources); • IF = ratio of mh/(mh+mb); Class Thresholds Low 0 to <0.2 Moderate low 0.2 to <0.4 Moderate 0.4 to < 0.6 Moderate high 0.6 to < 0.8 High >0.8 Equations are based on a simple Vollenweider approach, modified to account for dispersive exchange: Ocean inputs Anthropogenic inputs Estuary Bricker, S.B., Ferreira, J.G. & Simas, T. 2003. An Integrated Methodology for Assessment of Estuarine Trophic Status. Ecological Modelling. 169:39-60.
State: Overall Eutrophic Condition Stepwise Methodology Determine Chl a, macroalgae, D.O., SAV loss and HABs condition for each zone (conc/observance, spatial coverage, frequency of occurrence) 2) Determine expression for primary (average symptom values) and secondary (highest symptom value) 3) Combine primary and secondary for estuary condition • Level of expression is based on data, cumulative frequency (Chl a = 90th percentile; DO = 10th percentile) • GIS or GRID: Spatial area determined by GIS or Grid
Mississippi Changjiang ASSETS:BAD ASSETS: BAD ASSETS: Mississippi River Plume and Changjiang Indices Overall Human Influence (OHI) Overall Eutrophic Condition (OEC) Determination of Future Outlook (DFO) HIGH HIGH WORSEN ? HIGH HIGH WORSENHIGH Nutrient inputs High High High Unknown Low Unknown High HIgh No Problem High No Problem High Chl Macroalgae DO SAV HAB Future nutrient inputs Increase Increase Population (X 103) 73,009 400,000 Loading (tN y-1) 2,070,235 1,600,000 Watershed drains 40% of US, high livestock population Heavily populated characteristics Other influences Agriculture (crop & animal), Sewage, industry, commercial fishing shipping Management Plans Mississippi River/Gulf of Mexico GEF/UNEP Yellow Sea WatershedNutrient Task Force Large Marine Ecosystem Action Plan (reduce MARP to 5,000km2 (www.yslme.org), estimated 30-45% reduction N) China Blue Sea Action Plan