Download
1 / 21
240 likes | 1.25k Views
Unit Hydrographs Ch-7 (Streamflow Estimation). Transforming the Runoff from Rainfall. Unit Hydrograph Theory. Moving water off of the watershed… A mathematical concept (based on linearity) Linear in nature. Some History behind Unit Hydrograph Theory.

E N D
Unit HydrographsCh-7 (Streamflow Estimation) Transforming the Runoff from Rainfall
Unit Hydrograph Theory • Moving water off of the watershed… • A mathematical concept (based on linearity) • Linear in nature
Some History behind Unit Hydrograph Theory • Sherman – 1932(first to propose the concept of ‘Unit Hydrograph’) • Horton - 1933 • Wisler & Brater - 1949 - “the hydrograph of surface runoff resulting from a relatively short, intense rain, called a unit storm.” • The runoff hydrograph may be “made up” of runoff that is generated as flow through the soil (Black, 1990).
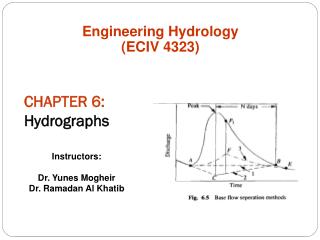
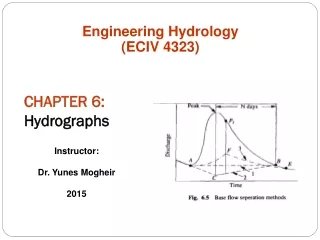
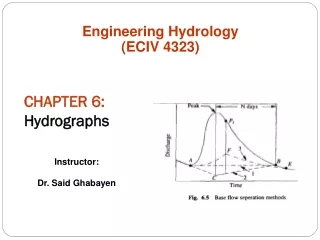
Unit Hydrograph Components Duration of excess precip. • Duration • Lag Time • Time of Concentration • Rising Limb • Recession Limb (falling limb) • Peak Flow • Time to Peak (rise time) • Recession Curve • Separation • Base flow Lagtime Timeofconcentration Baseflow Time Base
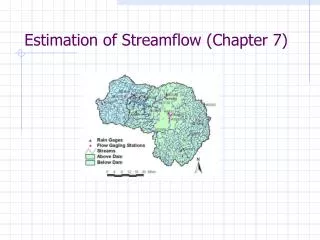
Methods of Developing UH’s • From Streamflow Data • Synthetically • Snyder (for CEE4420 – just know the formula for calculating lag and concentration times that are in the Gupta book • SCS • Time-Area (Clark, 1945) • “Fitted” Distributions
Unit Hydrograph • The hydrograph of direct runoff that results from 1-inch (or 1 unit) of excess precipitation spread uniformly in space and time over a watershed for a given duration. • The key points : • 1-inch of EXCESS precipitation • Spread uniformly over space - evenly over the watershed • Uniformly in time - the excess rate is constant over the time interval • There is a given duration pertaining to the storm – NOT the duration of flow!
Derived Unit Hydrograph Note: The baseflow shown here (and separated in next slide) was identified using a different graphical method). For the course – keep the baseflow separation simple to ‘flat rate deduction’ or the N=Ad0.2 approach)
Using a UH • Remember what we covered in class last time on how to predict direct runoff from a storm of given duration and depth of excess precipitation provided you knew the UH for the same duration of the storm: • “The direct runoff from a 2 hour storm with 2 units of excess rainfall shall be twice as much as the direct runoff from a 2 hour storm with 1 unit of excess rainfall”
Changing the Duration of UH • Very often, it will be necessary to change the duration of the unit hydrograph. Storms occur in all shapes (rainfall amount) and sizes (durations) • The most common method of altering the duration of a unit hydrograph is by the S-curve method. • The S-curve method involves continually lagging a unit hydrograph by its duration and adding the ordinates. • For the present example, the 6-hour unit hydrograph is continually lagged by 6 hours and the ordinates are added.
Develop S-Curve S-Curve: You get this by adding the ordinates of multiple 6 hr UHs below Continuous 6-hour bursts
Convert to 1-Hour Duration • To arrive at a 1-hour UH from a given 6 hour UH, two S-curves are lagged by 1 hour from each other and the difference between the two lagged S-curve (ordinates) is calculated for every timestep. • However, because the S-curve was formulated from unit hydrographs having a 6 hour duration of uniformly distributed precipitation, the hydrograph resulting from the subtracting the two S-curves will be the result of 1/6 of an inch of precipitation. • Thus the ordinates of the newly created 1-hour DR hydrograph in step 1must be multiplied by 6 in order to be a true unit hydrograph to get the final 1 hr UH. • The 1-hour UH should have a higher peak which occurs earlier than the 6-hour unit hydrograph. Does this make sense ? You are having the same amount of excess rainfall but in a shorter period so the storm is more intense and hence creates runoff faster.
Steps for Changing duration of UH • Suppose you are asked to change the duration of a given 2 hour UH to a 6 hour UH. Let tr=2hr (original duration) and trb=6hr (required duration). • First lag a minimum of tb/tr number of 2 hour UHs. So suppose, tb (time base of flow) is 12 hours, then in this case you should lag at least 12/2=6 2 hour UHs. Round off this number to the nearest higher integer. • Next, add all the ordinates as a function of time. You should get an S-type shape where the flow will reach a steady-state and saturated value. In exam, step#1 is very handy to save time. And the moment you get your highest flow value, that can be your S-curve peak value that you can maintain from thereafter. • Now lag two S-curves (derived in step#2) by duration trb (6 hour). And then subtract the ordinates. • Step #3 will give you a DRH for a trb duration storm. Multiply the ordinates by tr/trb to get your 6 hour UH from the given 2 hr UH.
Synthetic UHs • Snyder (this is good enough for course) • SCS • Time-area
Snyder • Since peak flow and time of peak flow are two of the most important parameters characterizing a unit hydrograph, the Snyder method employs factors defining these parameters, which are then used in the synthesis of the unit graph (Snyder, 1938). • The parameters are Cp, the peak flow factor, and Ct, the lag factor. • The basic assumption in this method is that basins which have similar physiographic characteristics are located in the same area will have similar values of Ct and Cp. • Therefore, for ungaged basins, it is preferred that the basin be near or similar to gaged basins for which these coefficients can be determined.
Significance of Unit Hydrograph • Watersheds response to a given amount of excess precipitation is just a multiplier of the unit hydrograph • Use unit hydrograph as a basis to determine the storm hydrograph from any given rainfall distribution
Example • Given the following rainfall distribution • The watershed will respond as follows
Example For hour 1: multiply your 1 hr UH by 0.5 and plot it starting at t=1hr For hour 2: multiply your 1 hr UH by 3 and plot it starting at t=2hr…. And so on You get four DRHs plotted for each hour as above
Example Now add all your ordinates to get the final DRH – shown here by the tallest DRH. This is the DRH you will get from the storm of 4 hours with variable intensity