Download
1 / 14
140 likes | 404 Views
Tools to Achieve Performance Excellence. Interrelationship Digraph. PEN Fall Conference, November 12, 2013 Karen Copp, Hennepin County. Concept . Used to determine which issues should be worked on first and how success will be measured

E N D
Interrelationship Digraph PEN Fall Conference, November 12, 2013 Karen Copp, Hennepin County
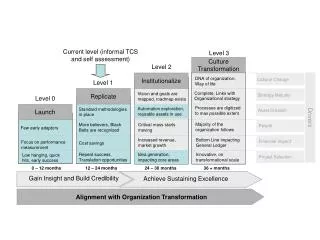
Concept • Used to determine which issues should be worked on first and how success will be measured • Graphically maps the cause and effect links among items generated • Encourages teams to think in multiple directions (not just linearly) • Key issues emerge naturally • Systematically surfaces assumptions and reasons for disagreement • Allows team to identify root cause(s) when credible data doesn’t exist
Town of Andover, MA Example • DRIVER: If the focus on the citizen as a customer becomes the core of the town’s vision then everything else will be advanced • OUTCOME: It puts the preservation of nature in the town as a key indicator of the vision working
Tips and Tricks • Avoid rushing through the process • Don’t choose more than 2-3 key factors to pursue further • Pay attention to the collective experience and intuition of the group • TRUST THE PROCESS