Download
1 / 1
10 likes | 142 Views
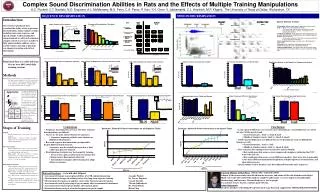
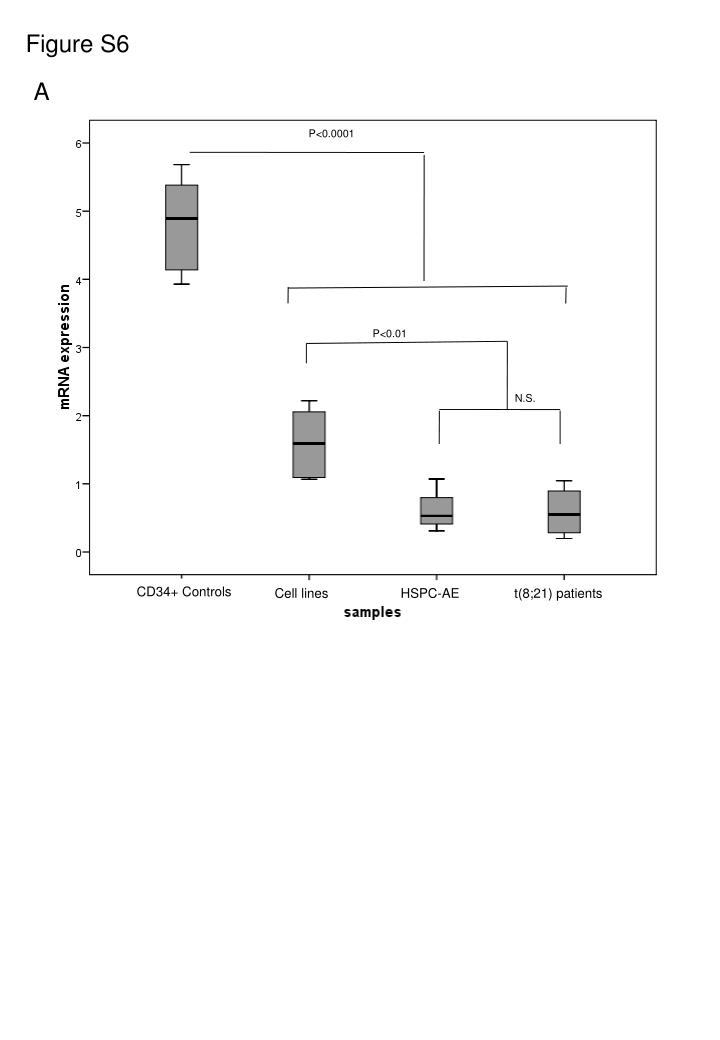
Figure S6. A. P<0.0001. P<0.0001. P<0.01. P<0.01. N.S. N.S. CD34+ Controls. Cell lines. HSPC-AE. t(8;21) patients. Cell lines. HSPC-AE. t(8;21) patients.

E N D
Figure S6 A P<0.0001 P<0.0001 P<0.01 P<0.01 N.S. N.S. CD34+ Controls Cell lines HSPC-AE t(8;21) patients Cell lines HSPC-AE t(8;21) patients