Download
1 / 19
250 likes | 1.09k Views
Percolation on a 2D Square Lattice and Cluster Distributions. Kalin Arsov Second Year Undergraduate Student University of Sofia, Faculty of Physics Adviser: Prof. Dr. Ana Proykova University of Sofia, Department of Atomic Physics. CONTENTS. What is Percolation? Applications

E N D
Percolation on a 2D Square Lattice and Cluster Distributions Kalin Arsov Second Year Undergraduate Student University of Sofia, Faculty of Physics Adviser: Prof. Dr. Ana Proykova University of Sofia, Department of Atomic Physics
CONTENTS • What is Percolation? Applications • Types of Percolation • Size and dimensional effects • Clusters and their distributions • Hoshen-Kopelman labeling algorithm • Results • Acknowledgements
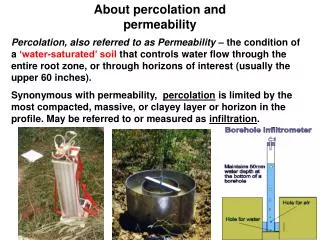
What is Percolation? Passage of a substance through a medium Every day examples: • Coffee making with a coffee percolator • Infiltration of gas through gas masks Mathematical theory
Some Applications of Percolation Theory Physical Applications: • Flow of liquid in a porous medium • Conductor/insulator transition in composite materials • Polymer gelation, vulcanization Non-Physical Applications: • Social models • Forest fires • Biological evolution • Spread of diseases in a population
Types of Percolation • Depending on the relevant entities • site percolation • bond percolation • Depending on the lattice type we consider percolation on • a square lattice • a triangular lattice • a honeycomb lattice • a bow-tie lattice
Types of Percolation • Site percolation • The connectivity is defined for squares sharing sites (the substance passes through squares sharing sites) • Bond percolation • the substance passes through adjacent bonds
Main Lattice Types square lattice triangular lattice honeycomb lattice bow-tie lattice
Size and Dimensional Effects • Influence of the linear size of the system • increase of the spanning probability with the system size • Influence of the dimensionality • smaller spanning probabilities for higher dimensions
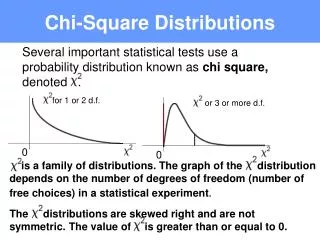
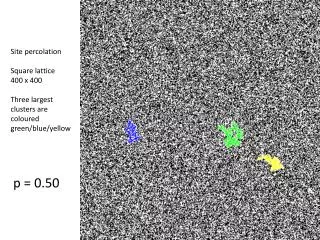
Clusters and Their Distributions • A cluster is a group of two or more neighboring sites (bonds) sharing a side (vertex) • Cluster-size distribution ns (ns: total number of s-clusters divided by L2, L – the linear size of the system) Near the critical point: ns s-t, t =187/91≈2.05(5) If then
Clusters and Their Distributions • Mean cluster size S(p) is the mean size of the cluster (without the percolating cluster, if it exists) to which a randomly chosen occupied site belongs or
Hoshen-Kopelman Labeling Algorithm • Developed in 1976 by Hoshen and Kopelman • Advantages • simple • fast • no need of huge data files (the lattice is created on the fly) • uses less memory than other algorithms • gives us the clusters’ sizes as a secondary effect!!!
Hoshen-Kopelman Algorithm • Clever ideas: one line, instead of a matrix, is kept; cluster labels are divided into good – a positive number, denoting the size of the cluster and bad – negative, denoting the opposite to the good cluster label they are connected to. N(1) = 2; N(2) = 3 N(3) = 1 N(1) = 11; N(2) = -1 N(3) = -2
Results: Cluster-Size Distribution ns t ≈ 2.065: Excellent agreement with the theoretically predicted t ≈ 2.055
Results: Spanning Probability W(p) • Spanning probability W(p) isthe ratio: No_of_percolated_systems all_systems
Acknowledgements • Ministry of Education and Science: Grant for Stimulation of Research at the Universities, 2003 • The members of the “Monte Carlo” group • My parents
“Monte Carlo” Group Members • Prof. Dr. Ana Proykova, Group leader • M.Sc. Stoyan Pisov, Ass. Prof. • M.Sc. Evgenia P. Daykova, Ph.D. Student • B.Sc. Histo Iliev, Ph.D. Student • Mr. Kalin Arsov, Undergraduate Student • M.Sc. Ivan P. Daykov, Ph.D. Student (Cornell USA/UoS)
More Information • http://cluster.phys.uni-sofia.bg:8080/kalin/