Download
1 / 32
320 likes | 327 Views
This report analyzes the trends in precision soil testing in Montana from 1997 to 2016, comparing zone or grid samples to conventional whole field composite samples. It provides data on soil nitrate variability, soil nutrient levels, and pH levels across different fields in Montana.

E N D
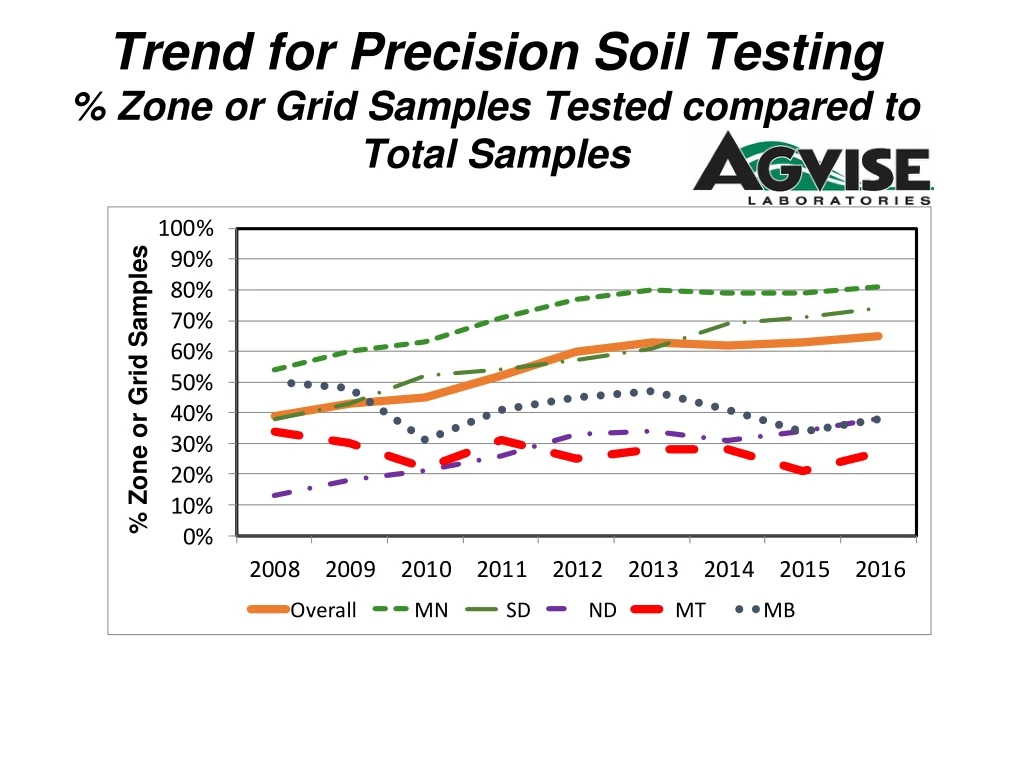
Trend for Precision Soil Testing% Zone or Grid Samples Tested compared to Total Samples
%Zone or Grid Samples Tested Compared to Conventional Whole Field Composite Samples in 2016
AGVISE Laboratories%Zone or Grid Samples – Northwood laboratory1997 - 2016 % Grid or Zone Samples Tested Compared To Conventional Whole Field Composite Samples Tested
Average Soil Nitrate following Wheat in 2016 Fall 2016 samples (lb/a 0-24” samples) 36 34 52 49 29
Soil Nitrate Variability Between Fields Following “WHEAT” in Montana - 2016
Average Soil Nitrate following Wheat in 2016 MB Fall 2016 Samples 37 (lb/a 0-24” samples) 36 37 32 45 19 45 39 43 30 38 34 36 36 ND 43 60 41 45 45 49 55 MN 44 42 SD 43 50
Average Soil Nitrate following “Fallow” in 2016 Fall 2016 samples (lb/a 0-24” samples) 52 51 52 52 44
Soil Nitrate Variability Between Fields Following “Fallow” in Montana - 2016
% Soil Samples with Phosphorus less than 10 ppm Fall 2016 samples (0-6”) (Olsen P test) 39% 56% 31% 53% 46% 36%
% Soil Samples with Potassium less than 150 ppm Fall 2016 samples (0-6”) 2% 6% 1% 13% 17% 8%
% Soil Samples with Potassium less than 150 ppm MB Fall 2016 samples 25% 13% (0-6” samples) 26% 26% 21% 6% 13% 26% 10% 5% 4% 1% 13% 72% 36% ND 8% 19% 59% 5% 41% 5% 46% 2% 5% 32% MN 33% SD 43% 1% 5% 35% 43%
% Soil Samples with Zinc less than 1.0 ppm Fall 2016 samples (0-6”) 84% 80% 79% 58% 51% 55%
% Soil Samples with Zinc less than 1.0 ppm MB Fall 2016 samples 47% 58% (0-6” samples) 62% 52% 26% 76% 44% 33% 31% 73% 81% 82% 41% 65% 34% ND 49% 70% 21% 77% 53 58% 19% 75% 44% MN 51% 27% SD 44% 57% 43% 38% 26%
% Soil Samples with Sulfur less than 15 lb/a Fall 2016 samples (0-6”) 59% 54% 51% 34% 26% 54%
% Soil Samples with Sulfur less than 15 lb/a MB Fall 2016 samples 16% 23% (0-6” samples) 16% 12% 9% 20% 25% 16% 16% 49% 21% 27% 13% 52% 21% ND 32% 76% 21% 40% 43% 52% 80% 49% MN 67% 34% 65% SD 90% 88% 68% 44% 68%
% Soil Samples with Copper less than 0.5 ppm Fall 2016 samples (0-6”) 1% 5% 1% 9% 4% 3%
% Soil Samples with Copper less than 0.5 ppm MB Fall 2016 samples 12% 7% (0-6” samples) 28% 5% 31% 17% 18% 22% 16% 6% 15% 3% 23% 36% 36% ND 11% 56% 10% 30% 15% 14% 34% 16% 7% MN 6% 10% SD 6% 4% 6% 1%
% Soil Samples with Boron less than 0.4 ppm Fall 2016 samples (0-6”) 15% 6% 5% 11% 5% 22%
% Soil Samples with Boron less than 0.4 ppm MB Fall 2016 samples 2% (0-6” samples) 1% 3% 1% 6% 2% 9% 11% 2% 3% 2% 4% 7% 27% 8% ND 4% 17% 34% 84% 4% 11% 57% 16% 13% 9% MN 14% SD 10% 36% 9% 11% 37%
% Soil Samples with Chloride less than 40 lb/a Fall 2016 samples (0-6”) 80% 70% 75% 50% 48% 80%
% Soil Samples with Chloride less than 40 lb/a MB Fall 2016 Samples 44% (0-24” samples) 39% 42% 63% 24% 80% 55% 41% 37% 84% 61% 69% 67% 45% 75% ND 64% 85% 59% 54% 86% 92% 90% 52% MN 62% 86% SD 61% 83% 75%
% Soil Samples with Carbonate greater than 5.0% Fall 2016 samples (0-6”) 2% 14% 20% 18% 10% 58%
% Soil Samples with Carbonate greater than 5.0% MB Fall 2016 samples 30% (0-6” samples) 56% 25% 22% 19% 2% 14% 33% 8% 11% 7% 4% 17% 24% 5% ND 9% 11% 11% 26% 4% 10% 0% 1% MN 12% 26% SD 4% 10% 2% 1%
% Soil Samples with Salts greater than 1.0 mmhos/cm Fall 2016 samples (0-6”) 6% 3% 3% 5% 9% 2%
% Soil Samples with Salts greater than 1.0 MB Fall 2016 Samples 18% (0-6” samples) 13% 20% 19% 8% 4% 20% 12% 3% 15% 8% 24% 11% 6% ND 12% 4% 3% 19% 7% 2% 3% 19% MN 8% 3% SD 1% 1% 2% 9% 2%
% Soil Samples with soil pH greater than 7.3 Fall 2016 samples (0-6”) 70% 82% 68% 83% 88% 60%
% Soil Samples with Soil pH greater than 7.3 MB Fall 2016 samples 62% 94% (0-6” samples) 79% 72% 91% 69% 57% 78% 73% 72% 75% 54% 73% 45% 96% ND 43% 8% 64% 43% 78% 27% 47% 11% 17% MN 40% 55% SD 43% 30% 16% 28% 21%
% Soil Samples with soil pH less than 6.0 Fall 2016 samples (0-6”) 3% 2% 5% 5% 1% 6%
% Soil Samples with Soil pH less than 6.0 MB Fall 2016 samples 2% 0% (0-6” samples) 4% 4% 0% 1% 15% 7% 1% 2% 1% 4% 6% 11% 1% ND 14% 34% 3% 16% 4% 13% 16% 17% 16% MN 13% 9% 19% SD 16% 43% 35% 18% 10%
% Soil Samples with %OM less than 3.0% Fall 2016 samples (0-6”) 92% 76% 73% 76% 80% 48%
% Soil Samples with %OM less than 3.0% MB Fall 2016 Samples 8% 10% (0-6” samples) 21% 11% 34% 22% 34% 25% 24% 71% 33% 45% 26% 28% 37% ND 30% 60% 76% 29% 27% 35% 25% 55% MN 28% 13% 10% SD 9% 29% 4% 25% 7%
Zip codes for Montana 599 595 592 594 598 596 593 590-591 597