Download
1 / 39
400 likes | 616 Views
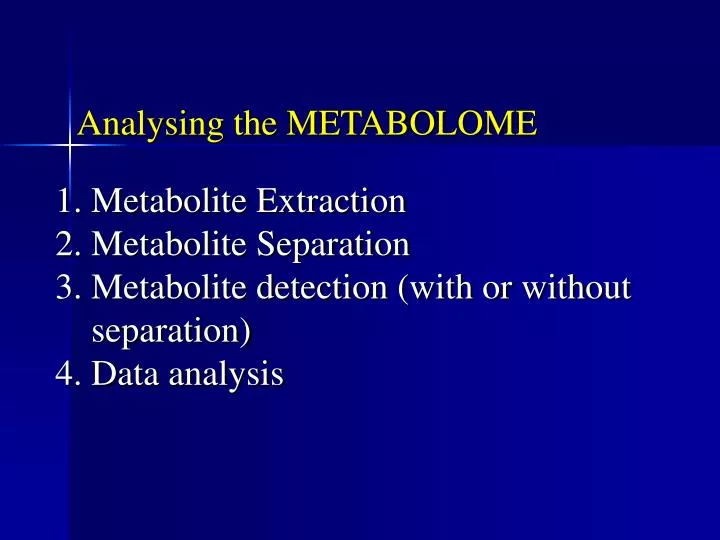
Analysing the METABOLOME. Metabolite Extraction Metabolite Separation Metabolite detection (with or without separation) Data analysis. Analysing the METABOLOME. Metabolite Extraction Metabolite detection (with or without separation) Data analysis. EXTRACTION

E N D
Analysing the METABOLOME • Metabolite Extraction • Metabolite Separation • Metabolite detection (with or without separation) • Data analysis
Analysing the METABOLOME • Metabolite Extraction • Metabolite detection (with or without separation) • Data analysis
EXTRACTION • Each group of metabolites will have an optimal extraction method • (no single solution) • Stopping the enzymatic activity!!
Metabolite Extraction • Liquid phase extraction Grind sample, extract with solvent • Liquid : Liquid extraction Take liquid extract, extract with another solvent • Solid : Liquid Extraction Take liquid extract, extract with solid phase material
Volatile Metabolite Extraction • Steam distillation • Headspace • Headspace & solid phase extraction (Trapping) • Solid phase micro-extraction (SPME)
Solid Phase Micro Extraction (SPME) To GC-MS injection port
Headspace & solid phase extraction(Trapping) Measuring Headspace Volatiles Emitted by Arabidopsis Tenax Inlet Outlett
Headspace & solid phase extraction(Trapping) Measuring Headspace Volatiles Emitted by Roses
Analysing the METABOLOME • Metabolite Extraction • Metabolite detection (with or without separation) • Data analysis
Metabolite detection as part of Metabolome Analyses Technologies Detection methods (MS, direct/flow injection) Separation /detection methods (LC-MS) Separation /combination of detection methods ) LC-NMR-MSׁ(
Metabolite detection Metabolome Analyses Technologies • Infrared spectroscopy (IR) • Nuclear magnetic resonance (NMR) • Mass spectrometry (MS) • Thin layer chromatography (TLC) • High performance liquid chromatography (HPLC) equipped with different • kinds of detectors: UV or photodiode array (PDA), fluorescent, • electrochemical, etc. • Capillary electrophoresis (CE) coupled to different detectors: UV, laser induced fluorescent (LIF), mass spectrometer (MS or MSMS), etc. • Gas chromatography (GC) coupled to different detectors: MS or MSMS, FID • Liquid chromatography tandem mass spectrometry (LC/MS or LC/MS/MS) • Fourier transform ion cyclotron mass spectrometry (FTMS) • HPLC coupled to NMR detection (LC/NMR) • HPLC coupled to NMR and MS detectors (LC/NMR/MS)
Metabolite Detection No single solution! most used systems are: • GC-MS: Naturally volatile or made volatile (any organic- flavors, sugars, lipids, acids) • HPLC- Chromatography + detector For example UV-detector (phenolics) or MS • NMR – Any Compound containing hydrogen • LC-MS/NMR- compounds that are not well characterized by other methods. Structure elucidation capacity
Separation Methods • Thin layer chromatography • High Performance Liquid Chromatography (HPLC) • Gas chromatography (GC) • Capillary electrophoresis (CE)
HPLCSeparation Polarity of mobile phase changes, the rate at which polarity changes is the "gradient" Stationary phase
pores silica d Stationary Phase in the HPLC Column Analytical HPLC – 3, 5, 10 µm particle size
Stationary Phase and Mobile Phase in HPLC As the analytes pass through the column they interact between the two phases--mobile and stationary--at different rates. The difference in rates is primarily due to different polarities for the analytes.
HPLC- Normal & Reverse Phase Normal Phase Chromatography: Stationary Phase- polar and Mobile phase- non-polar Least polar analyte elutes first Reverse Phase Chromatography: Stationary Phase- non-polar and Mobile phase-polar Most polar analyte elutes first
Separation Methods • Thin layer chromatography • High Performance Liquid Chromatography (HPLC) • Gas chromatography (GC) • Capillary electrophoresis (CE)
3. Gas Chromatography (GC) • The sample is vaporized in the injection port • Sample injected to the head of the chromatographic column • The sample transported through the column (in a heated oven) by the flow of inert, gaseous mobile phase • Separation according to boiling points of compounds
Detectors for HPLC • 1.UV/VIS: • - Fixed wavelength • - Variable wavelength • - Diode array • 2. Refractive index • 3. Fluorescence • 4. Conductivity • 5. Antioxidant • 6. Evaporative light scattering • 7. Electrochemical • 8. Mass Spectrometer
Detectors • 1. UV/VIS: • - Fixed wavelength • - Variable wavelength • - Diode array • 2. Refractive index • 3. Fluorescence • 4. Conductivity • 5. Antioxidant • 6. Evaporative light scattering • 7. Electrochemical • 8. Mass Spectrometer
Fluorescence vs. UV Detection Fluorescence Excitation at 250 nm Emission at 395 nm UV Absorbance 254nm
About the Mass Spectrometer Detector In the next class
HPLC Chromatogram of a Tomato Sample Tomato, WT, peel, MaxPlot 240-400 nm
MaxPlot 240-400 nm Peaks assignment: Comparison of sample chromatogram with the known standards 1. Comparison of Retention times (RT)
Analysing the METABOLOME • Metabolite Extraction • Metabolite detection (with or without separation) • Data analysis (HPLC-PDA only)
Data analysis The data transformation required in profiling techniques such as GC/MS and LC/MS. Areas of mass chromatographic peaks corresponding to components (a,b,c...n) are entered into a peak table for each sample chromatogram (1,2,3...z).
Tomato, Ailsa Craig, WT, peel MaxPlot 240-400 nm Tomato, mutant LA 3189, peel MaxPlot 240-400 nm Data analysis Metabolite profiling of Tomato samples
Data analysis Peak table for WT and mutant samples, replicate injections