Download
1 / 24
240 likes | 260 Views
WCTA – Zero Waste to Landfill Waste-to-Energy: Science, Policy & Politics. Scott M. DuBoff Garvey Schubert Barer. October 24, 2012. Overview. WTE – a largely untapped resource in the U.S. – 7% WTE vs. 69% landfilling.

E N D
WCTA – Zero Waste to LandfillWaste-to-Energy: Science, Policy & Politics Scott M. DuBoff Garvey Schubert Barer October 24, 2012
Overview WTE – a largely untapped resource in the U.S. – 7% WTE vs. 69% landfilling Source: The State of Garbage in America, http://www.jgpress.com/archives/2010_10.html (Biocycle, Oct. 2010).
Overview(cont’d) ► WTE has far greater use in many other nations that are at least equally conscientious stewards of the environment ► The former Chief of USEPA’s Energy Recovery Branch: “If you want to have an impact on greenhouse gas mitigation, focus on MSW [because there’s] nationally significant energy available from MSW combustion [and] even if you have >50% recycling, you still have a significant amount of energy to recover” ► World Economic Forum, January 2009, Green Investing – Towards a Clean Energy Infrastructure: recognizes WTE as one of eight “key renewable energy sectors” and “particularly promising in terms of . . . abatement potential” for carbon emissions ►The Nature Conservancy ranks WTE as one of the most environmentally protective alternative energy sources ► Background points follow
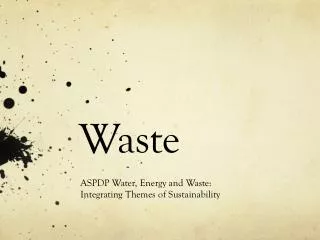
Here Are the Facts: • Using advanced emissions control technology, WTE emissions have plummeted since the late 1980’s • WTE emissions are lower than landfill emissions for 9 of 10 major air pollutants • CO2e (carbon dioxide and equivalent emissions) is an example
Comparison of CO2 Equivalents Source: P. Ozge Kaplan, Joseph DeCarolis, and Susan Thorneloe, “Is It Better To Burn or Bury Waste for Clean Electricity Generation,” Environmental Science & Technology
The Facts:(cont’d) • WTE’s efficiency and reliability are clear as well: • Current U.S. WTE facilities recover approximately 600 kWh of electricity per ton of waste – 10 times the electric energy recoverable from a ton of landfilled waste • Advanced WTE facilities can recover approximately 900 KWh per ton of waste – 14 times more than landfilled waste
The Facts:(cont’d) • WTE is base-load generation, available 24/7 and unaffected by days that are cloudy or calm • WTE is also a prime example of “distributed generation” that serves nearby load without the need for new long-distance transmission lines • USEPA: WTE “produce[s] 2800 megawatts of electricity with less environmental impact than almost any other source of electricity” • EPA’s hierarchy for “integrated waste management” recommends waste combustion with energy recovery over landfilling (as does the European Union)
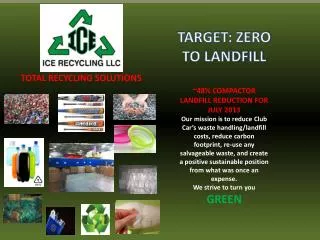
SYCTOM Isseane WTE Plant, Paris
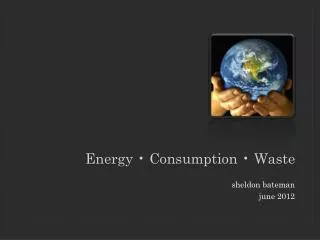
Vienna – Spittelau WTE facility
The Facts – Mitigation of Climate Change • WTE’s role in reducing GHG emissions is widely recognized • Using life-cycle analysis, USEPA’s solid waste management planning methodology addresses the 3 ways in which WTE reduces GHG emissions: • Generating electricity and/or steam without having to use fossil fuels • Avoiding the potential methane emissions that would result if the same waste was landfilled, and • Recovering ferrous and nonferrous metals, which avoids the additional energy consumption that would be required to produce the same metals from virgin ores
Mitigation of Climate Change(cont’d) • One ton of CO2e is widely recognized as being avoided for every ton of MSW directed to a WTE facility rather than landfilled (comparison based on a modern landfill with methane recovery and reuse) • Moreover, the CO2e avoided increases beyond 1 ton when WTE is used for co-generation, i.e., electricity and district heating • The Intergovernmental Panel on Climate Change emphasizes WTE’s dual benefits of (i) offsetting fossil fuel combustion and (ii) avoided landfill methane emissions • Same – Kyoto Protocol’s Clean Development Mechanism:approves WTE as a source of tradeable GHG emission reduction credits that displaces electricity from fossil fuels and avoids landfill methane emissions
Mitigation of Climate Change(cont’d) • Let’s put this in context: • King County’s Draft 2009 Solid Waste Plan notes the gas recovery-reuse system in place at Cedar Hills landfill avoids CO2e emissions equal to 22,000 passenger cars • But the County’s 2010 disposal volume at Cedar Hills, 826,700 tons, combined with Seattle’s 2010 waste disposal, 335,500 tons, and an average of one ton of CO2e avoided per ton of MSW processed at a WTE facility vs. landfilled, would result in a GHG reduction equivalent to removing more than 227,000 passenger cars from King County’s roads – about 1 car in 6
California Air Resources Board • Context – California’s “cap-and-trade” program for GHGs, the “Global Warming Solutions Act of 2006” (AB 32) • A key requirement – affected sources must purchase CO2 allowances • CARB’s initial draft proposal (Nov. 2009) would have applied the CO2 allowance requirement to WTE • CARB staff has changed course several times • Finally, last month: • CARB concludes that California’s WTE facilities provide a net reduction in GHG emissions compared to landfilling • CARB directs its staff to exempt WTE facilities from California’s cap-and-trade program for GHGs • A very significant decision that transcends California
The Facts – WTE Encourages Recycling • WTE communities outperform non-WTE communities in recycling – recycling rates are typically at least 5 percentage points above the national average and in some cases lead the nation in recycling • Confirmed by a June 2009 national survey, Recycling and Waste-to-Energy: Are They Compatible? 2009 Update, Eileen Brettler Berenyi, Ph.D (June 2009) Governmental Advisory Associates, Inc., 599 Riverside Avenue, Westport, CT 06880
WTE Encourages Recycling(cont’d) • State laws also discourage diversion of recyclable materials to combustion in a WTE facility: • For example, an Oregon county using WTE cannot “take any action that would hinder or discourage recycling activities in the county.” Ore. Rev. Stat. § 459.153 • That statute is focused on WTE-reliant Marion County, which consistently achieves one of the highest recycling rates in the nation – 60.8
WTE Encourages Recycling(cont’d) • The track record in Europe • European countries with greatest reliance on WTE also have the highest recycling rates – examples: • Germany – 64% recycling, 1% landfilling and 35% WTE • Sweden – 49% recycling, 4% landfilling and 47% WTE
WTE and Jobs • New WTE facilities will employ on average 50-60 FTE with annual payroll and employee benefits exceeding $5,500,000 (example for Frederick, Maryland – 1,500 TPD facility) • These are skilled labor positions and good-paying jobs • Frederick County estimates that 1,678 private sector jobs will be created during construction of its new WTE facility – plus $260 million of increased spending on local goods and services during construction and $12 million per year thereafter in increased local spending
WTE and Jobs(cont’d) • Comparing the jobs impact of WTE versus landfills: • These figures are for long-term operation − for construction phase employment, WTE’s benefits are even more pronounced (as noted above)
Federal Energy Legislation • The “Renewable Energy Standard” (RES) of the 111th Congress (2009-10) became the “Clean Energy Standard” (CES) of the 112th Congress (2011-12) • Current status: disagreement and stalemate – awaiting the election • Precarious start for WTE in the 111th Congress (e.g., Markey-Platts, H.R. 890, etc.) • The situation is now considerably different and much improved for WTE
Federal Energy Legislation(cont’d) • S. 2146, the Clean Energy Standard Act of 2012 • Principal sponsor, Sen. Jeff Bingaman, D-New Mexico, • President Obama’s Jan. 2011 State of the Union address proposed a national CES – repeated in the Jan. 2012 State of the Union • S. 2146 – Very positive treatment of WTE: the only source of anthropogenic CO2 that receives full CES credit for each MWh of electricity sold
Perspectives …[A] synergy has developed . . ., unstated and perhaps unintentional, created through the combination of the energies of proponents of recycling and composting to achieve zero waste and the economic power of the lucrative landfilling industry. The former seek a laudable, but unrealizable goal, of 100% reduction/recycling/composting of waste. The latter, quietly continue their landfilling business, investing in new and bigger units, and thus showing with their investment capital that they believe a high level of landfilling will continue well into the foreseeable future so long as the status quo is maintained. This synergy has locked most jurisdictions into that status quo: landfilling over 60% of the MSW generated. Brandes & Themelis, NAWTEC 19, May 2011