Download
1 / 65
810 likes | 1.37k Views
Trip Generation Basics and Cautions of Site Impact Review. Trip Generation. Simple trip generation calculation needed even when the large scale models are used. Large scale regional models are not intended for small areas. Simple Trip Generation Example.

E N D
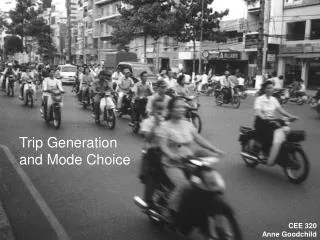
Trip Generation Simple trip generation calculation needed even when the large scale models are used. Large scale regional models are not intended for small areas.
Simple Trip Generation Example 10 = Daily Trip Generation Rate for a Single Family Home 10= Homes being built • (called “Dwelling Units”) • Homes are the “Independent Variable” How many daily trips do we project? 100
Trip GenerationReport and use of the 7th Edition ITE Trip Generation Report and Handbook
ITE Trip Generation Report Not a Manual • National data – Florida, Arizona and California, played big role • Suburban locations with little or no transit • Some small sample sizes for new (though important) uses • Discount clubs (861) • Stand-alone drug stores (881) • May not work downtown
What is a Trip End? one trip two trips • Number of trips that come in or go out of a development • (Volume at Driveways) • A trip end is a single or one-direction vehicle movement with either the origin or destination (exiting or entering) inside the study site.
Journey/Trip/Trip Ends 2 TRIP ENDS ONE TRIP 1 Journey (Home-Work-Shops-Home) 3 Trips (Home to Work) (Work to Shops) (Shops to Home) 6 Trip Ends (2 Per Trip) 2 TRIP ENDS Start Stop ONE TRIP ONE TRIP 2 TRIP ENDS
Vehicle Trips (ITE) vs. Person Trips 1 Vehicle Trip 5 Person Trips Person Trips ITE Trips
How Are Trip Generation Rates Determined? 1000 Traffic is then studied in relation to the size of certain “independent variables.” 10,000 sq ft store 250 employees Tube laid • Traffic is counted at each entrance of a certain land use. 1,000
What is Meant by “Daily Trips”? SUN MON TUE WED THU FRI SAT 1 2 3 4 5 6 7 8 9 10 11 12 13 14 15 16 17 18 19 20 21 22 23 24 25 26 27 28 29 30 31 • For our use, we usually mean the number of WEEKDAY TRIPS. • The ITE Manual Also Has Some Data On: • Saturday • Sunday • Christmas Holiday Season
Land Use (ITE Code) Independent Variable Time Period 6.72 Trip Generation Rate
Independent Variable Time Period Trip Generation Rate
Calculated Trips Each “X” is a study Independent Variable
Trip Generation Problem #1 • Someone is proposing an apartment complex with 100 dwelling units. • Using the average trip rate, what are the estimated daily trips? Units Rate Trips ______ X ____ = _____________ What if there were 250 units? ______ X ____ = _____________
What’s Peak Hour? • Any 4 consecutive 15 minute periods that equal the highest 1 hour volume • There are usually morning and evening • Some lunch time peaks are important • We are usually using peak hour of Adjacent Street Traffic
Generator vs. Adjacent Street Traffic • Usually the same PM peak for shopping, office and residential • Hospitals, industrial and schools may be different due to different work shifts • Fast food restaurants have short trip durations and peak during mid-day peak periods
Critical Hour Analysis Period for Various Types of Developments
Trip Generation Problem # 2 • Someone is proposing an apartment complex with 100 dwelling units. What would be the peak hour directional trips for the PM Peak Hour of adjacent street traffic?Units Rate Trips ______ X ____ = _____________ Trips Distribution Trips enter ______ X ____ = _____________ exit ______ X ____ = _____________
PM Peak Hour Trips Aren’t Always Equal • Shopping Center (820) • 202,400 sq.ft = 1,000 Peak Hour trips • 480 in • 520 out • General Office (710 ) • 821,300 sq.ft = 1,000 Peak Hour trips • 170 in • 830 out See peaking characteristics
Think About It • When would a major office development have the most impact on the surrounding road system?
Best Independent Variables Shopping Centers and Malls Gross Leaseable Area Offices and other “Single” uses Gross Floor Area Homes and Apartments Dwelling Units Gas Stations Fueling Positions
GFA includes all enclosed area for each floor GLA is only the area that can be used by shops Does not include parking areas or common pedestrian areas Gross Leaseable Area (GLA) Gross Floor Area (GFA)
What’s a Fueling Position? Maximum Number of Vehicles that can be Fueled Simultaneously.
3,350 sq ft Convenience Market – Applicant Claimed 4 Fueling Positions and 138 Daily Trips
Shopping Center (820) 407 studies 379,000 sq.ft. Gross Leasable average Rate in PM Peak =3.75 Specialty Retail Center(814) 5 studies 69,000 sq.ft. Gross Leasable average Rate in PM Peak = 2.71 Specialty Retail vs. Shopping Center Read the Descriptions in the ITE Report
Size Does Matter 35 12 1 11 2 10 9 3 8 4 7 5 6 7 3 Convenient Market 100,000 ft2 Shopping Center 1.5 Million ft2 Mall Generally, the larger any use becomes the fewer number of trips generated per square foot. Trips per 1,000 ft2 (PM Peak)
Which to Use: Rates or Equations? Compare trips equation and rate ITE only provides equations for studies with enough data Consider the “unknowns” out parcels new land uses ITE Handbook has more guidance
How to Read the Fitted Curve Equation and Determine Trips Without a Scientific Calculator or Excel Rate Equation Approx. 2,800 peak hour trips 1 Million Square Feet
What the Formulas Look Like in Excel PM Peak Shopping Center PM Peak =EXP(0.66*LN(TSF)+3.40) PM Peak Office PM Peak = (1.12*(TSF)+78.81)
What about “Bubble” maps of development? AERIAL OF MALL 2.5 Million SqFt Commercial 2.5 Million SqFt Commercial = Or CLUSTER OF BLDS 2.5 Million SqFt Commercial 1 Mill. SqFt = 1.5 Mill. SqFt Smaller sites
Trip Generation Problem #3 • Someone is proposing a shopping center = 150,000 square feet • What would be the projected PM Peak Hour of adjacent street traffic? Use Average Rate: Units Rate Trips ______ X ____ = _____________ What if the mall were to be 1.5 million square feet? Units Rate Trips Avg. Rate ______ X ____ = _____________ Using Equation Line
Trip Generation Problem #3 • Someone is proposing a shopping center = 150,000 square feet • What would be the projected PM Peak Hour of adjacent street traffic? Use Average Rate: Units Rate Trips 150 3.75 563 ______ X ____ = _____________ What if the mall were to be 1.5 million square feet? Units Rate Trips 1,500 3.75 5,625 Avg. Rate ______ X ____ = _____________ 3,700 Using Equation Line
Trip Reduction? Parking Reduction? University of California Transportation Center: Access Number 12 Spring 1998
CONCLUSION As New Urbanists suggest, traditional shopping areas generate more walking than is usually associated with shopping trips. However, they also attract a significant number of customers who don’t live in the adjacent residential area and who drive there. Even those living in adjacent residential areas may drive, especially if they’re grocery shopping. Despite this high frequency of walking, the promise of less automobile traffic is not realized. Counts and surveys taken during average (not major) shopping days reveal levels of traffic and parking demand in excess of comparable standards for peak demand. http://www.uctc.net/access/access12.pdf
Driveway Traffic Will Include All Of The Pass By Traffic 1000 Beware when analyzing driveways: analysis must include pass-by trips in driveway volumes. 1,000
What you need to Know About Trip Generation • Simple trip generation is always needed • Read the descriptions of the ITE Report • Trip Generation studies are just estimates • Don’t be fooled by the precision • ITE’s Trip Generation methods may not work downtown • Be skeptical of major trip reductions until more studies are done • Don’t blindly use a “stock” percentage for internalization