Download
1 / 44
510 likes | 1.2k Views
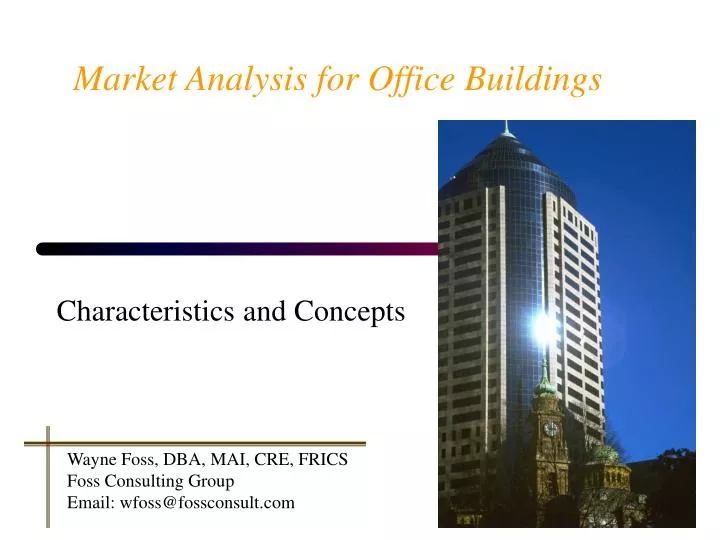
Market Analysis for Office Buildings. Characteristics and Concepts. Wayne Foss, DBA, MAI, CRE, FRICS Foss Consulting Group Email: wfoss@fossconsult.com. Building Users. Differentiated by Users/Tenants Major Institutional/Professional

E N D
Market Analysis for Office Buildings Characteristics and Concepts Wayne Foss, DBA, MAI, CRE, FRICS Foss Consulting Group Email: wfoss@fossconsult.com
Building Users • Differentiated by Users/Tenants • Major Institutional/Professional • Occupied by banks, insurance companies, professionals, corporate headquarters • General Commercial • Smaller buildings, accessible to workers and markets • Parking is important, tenants are sales oriented • Medical and/or Dental • Generally located near hospitals
Building Users • Differentiated by Users/Tenants • Quasi-industrial • may be located in industrial parks • flex and/or research and development • Pure industrial • part of a manufacturing operation • Government and/or Education
Building Terms • Gross Building Area (GBA) • Total area of the building in square feet • Rentable Area • Usually considered the tenant’s pro rata share of the entire building. • Excludes elements of the building that penetrate through the floor
Building Terms • Rented Area • Amount of space under lease in a building • Net Occupied Space (Useable) • Area within the building occupied by the tenant(s) • Efficiency ratio • Rentable area divided by gross building area • Store Area • Number of square feet in ground floor store area
Building Types • Trophy • highest quality building, one-of-a-kind • unique architectural design • outstanding location • Class A • excellent location and access • good quality materials and workmanship • good to excellent condition
Building Types • Class B • good location and good construction • may suffer from physical deterioration and some form of functional obsolescence • Class C • Older (15 to 25 years), may not meet current codes • may suffer from physical deterioration and some form of functional obsolescence • Rehab • older vacant or poorly occupied that if rehabbed could become Class A
General Concepts and Terms • Analysis of Competition • should recognize differences between building types • segmentation of supply by building classification • Office Space per Employee • norms change from market area to market area, and even between submarket areas within the same general market • generally average is 175 to 200 sq. ft. per employee
Market Analysis: the Six Steps • Step 1: Define the Product • (property productivity analysis) • Step 2: Define Users of the Property • (market delineation) • Step 3: Forecast Demand Factors • Step 4: Inventory and Forecast Competitive Supply • Step 5: Analyze and Interaction of Supply and Demand • (residual demand study) • Step 6: Forecast Subject Capture
Step 1: Define the Product Property Productivity Analysis • Identify the type of Office Building • tenants and construction quality • Analyze the site and the building • rate the subject in relation to the typical competition and/or industry standards • Analyze the location • rate the node to other competitive nodes within the metropolitan area. Consider linkages and direction of urban growth. • analyze the characteristics of the subject’s location within it’s node.
Location Analysis • Often reflects its convenience to office workers, support facilities and executive housing areas • Office node where the subject property is located is analyzed for its linkages and position in the urban growth pattern • comparing subject’s node to competitive office nodes • direction and rate of urban growth
Location Analysis • Identification of Office Nodes • Downtown (central business district) • Uptown • located along major arterial highways providing access to the suburbs • Shopping Centers • Office Parks • tend to be oriented toward manufacturing or research and development activity • Special Nodes • buildings serving attorneys, title companies and other uses often develop around major government buildings • Universities often provide a focal point for research and development and other office development
Location Analysis • Identification of Node Linkages • Employee and Management Housing • Support facilities within the node • hotel, restaurants, health clubs, shopping, printing, etc. • Associated office uses • i.e.: attorneys and courthouses; doctors and hospitals • Traffic conditions • Proximity or travel time to airports • Proximity to mass transit • Proximity to interstate highways
Location Analysis • Land Use considerations • Reputation of the area • Nuisances in the area • Traffic conditions adjacent to the site • One way streets • Curb cuts and median cuts • Pedestrian access to and from major support facilities • Parking availability and access • Natural amenities • view • beaches, lakes, etc. • Size and tenant mix • office clusters are based on the idea of face to face contact
Location Analysis • Citywide growth analysis • Procedure for analysis • map current major urban centers and housing areas • map current and committed roads, transit systems, airports, and other transportation facilities expected in the next 5 to 15 years • project and map any major land use expansion anticipated in the next 1 to 10 years • map the growth forecast for 10 to 20 years • locate the subject property within the present and forecast land use patterns • Questions to consider • where has office growth occurred in the past five years? • where are the largest residential and retail growth areas?
Step 2: Define the Users of the PropertyMarket Delineation • Specify the market of possible property users • the tenants in the building • the clientele the tenants will draw • most office space does not have a contiguous market area, generally broad metropolitan area, or sub-area • tenants and clientele will vary with the character of the cluster or node.
Step 3: Forecast Demand Factors • Inferred (trend) methods • general employment growth (decline) trends • general secondary data that reports total market occupancy and absorption • general trends in rents and/or sales • Fundamental methods • Forecast work force occupying office space • Estimate the size of the work force occupying space in the subject’s class of office building • Estimate the requisite space per office worker • Calculate demand for the specific class of office space
Inferred Methods Forecast Employment Growth Historical Absorption Trend:
Fundamental Method • Project Employment Growth for the Overall Market
Fundamental Method • Estimate Office Space Occupancy • Analysis of NAICS categories for employment that utilizes office space • Ratio Method:
Fundamental Method, con’t…. • Convert Office Occupancy into an Office space demand projection • Office Space per Employee • will vary by area • Source: Building Owners and Managers Assn. (BOMA) • Source: Black’s Guide
Fundamental Method, con’t…. • Convert Office Occupancy into an Office space demand projection: Ratio Method • Total Occupied Office Space divided by Total Employment equals Occupied Office Space per Employee
Fundamental Method, con’t…. • Reconcile Demand Forecast • Inferred Method • Growth Trends: Positive • Market Occupancy: Moderate Positive Citywide • Historical Absorption: 297,840 sf per year average last five years • Fundamental Method • Segmentation New Demand 1,759,750 sf • Ratio Method New Demand 1,634,828 sf • Average per Year: 326,966 to 351,950 sf
Step 4: Inventory and Forecast Competitive Supply • Inventory the current competitive office space within the subject’s building class • Inventory the competitive buildings under construction • Forecast the amount of space expected from proposed competitive buildings • Estimate the amount of space anticipated for demolitions, renovations, and conversions
Inventory of Space Under Construction and Forecast of New Planned Space • Review of Building Permits yields: • 25,000 sq. ft. currently under construction in SE area • 45,000 sq. ft. currently under construction in SW area • Research planned projects • interview building and planning officials, review newspaper announcements, interview brokers, lenders and developers active in the area. • Compile a list of possible projects and assess the probability of their completion.
Forecast the amount of space expected from proposed competitive buildings
Step 5: Analyze Interaction of Supply and Demand • Compare supply and demand to estimate residual demand • City wide residual demand: • Existing vacant space: 2,588,500 SF • Space under construction: 70,000 SF • Proposed space: 256,000 SF • Total Available Space 2,914,500 SF • Time needed to absorb the available, developing and proposed space, allowing for frictional vacancy: • 1,960,920 sf ¸ 352,000 sf/yr = 5.6 years • (2,914,500 sf - 953,580 frictional vacancy = 1,960,920 sf)
Segment to subject building type and area • Subject is a Class A building in SW area • SW area captures 30% city-wide demand • Class A buildings capture 83% of SW demand • Citywide 5-year new demand: 1,760,000 sf • Pct. SW area demand: 30% • SW demand: 528,000 sf • Pct. SW demand for Class A 83% • SW area Class A new demand: 438,240 sf • SW area Class A new demand/yr. 87,648 sf
Segment to subject building type and area • Compare SW area existing and potential competitive supply • Current Vacant Class A Space: 167,800 sf • Space under construction: 45,000 sf • Forecast new space: 234,000 sf • Total: 446,800 sf • Time needed to absorb the available, developing and proposed space, allowing for frictional vacancy: • 223,200 sf ¸ 87,648 sf/yr = 2.6 years • (446,800 sf - 223,600 frictional vacancy = 223,200 sf)
Step 6: Forecast Subject Capture • Inferred methods • analyze the subject’s competitiveness in view of the overall market forecast • Subject’s current occupancy is 85%, consistent with metro area occupancy of 86%, however SW area vacancy is only 4%. • Building rating table indicates that subject building is 10% below average, due to design deficiencies. • Fundamental methods • analyze specific submarket competition; rate the subject against competitive properties • make an inventory of all buildings in the competitive area that correspond to the area of the forecast data • compile a list of the elements to be rated
Step 6: Forecast Subject Capture • Reconciliation • Subject is 85% occupied • Absorption of vacant space is forecast to take about 3 years before the submarket shows excess demand. • Rating analysis suggests that subject is 10% inferior to the market • Forecast is that subject occupancy and rents will lag the market
So That’s - - -Market Analysis for Office Buildings Are there any Questions? Wayne Foss, DBA, MAI, CRE, FRICS Fullerton, CA USA Email: waynefoss@usa.net