Download
1 / 17
170 likes | 322 Views
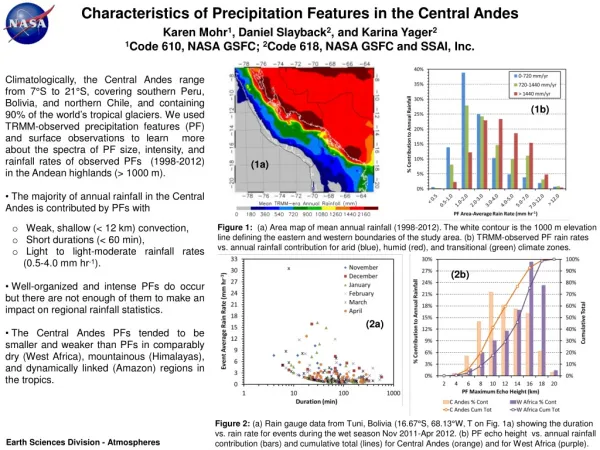
A Climatology of Precipitation Efficiency in the Central Appalachian Mountain Region. James Morrow Nick Luchetti. Precipitation Efficiency = Precipitation/ Precipitable Water (i.e. moisture available through the depths of the atmosphere)

E N D
A Climatology of Precipitation Efficiency in the Central Appalachian Mountain Region James Morrow Nick Luchetti
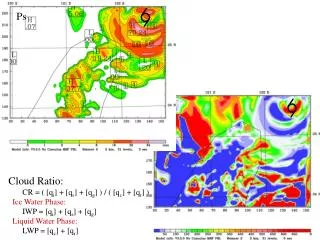
Precipitation Efficiency = Precipitation/Precipitable Water (i.e. moisture available through the depths of the atmosphere) • Ratio represents the the fraction of available water vapor in the atmosphere that is translated into precipitation reaching the surface. • Factors that alter the ratio: • Storm Motion, Moisture Convergence, Coverage of Precipitation, Amount of lifting and instability release.
Objectives: • Highlight any trends that may signal a recent change in the regional climate • Drought concerns • Heavy precipitation event concerns • Highlight the inter-annual variability in seasonal precipitation efficiency • Identify climate system controllers • Create a climatological visual display for operational forecasters to use when issuing watches and warnings.
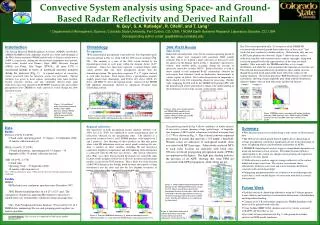
Study Area • Varying degrees of elevation • Flash flooding susceptibility • 25 weather stations
Methods • 1982-2012 • Daily Precipitation data extracted from the National Climatic Data Center’s weather station database. • Precipitablewater data were gathered for a 2.5° latitude x 2.5° longitude area centered on Blacksburg, Virginia (elevation 640 m) • Re-analysis data base of NOAA’s Earth Systems Research Laboratory. • 31-year median ratios were spatially plotted using GIS(Inverse Distance tool) • Inter-annual median ratios vs. Multivariate ENSO Index(MEI) values were plotted.
Potential Controller-Orographic Lift • Atmospheric instability • Lower-atmospheric evaporation of hydrometers R^2 = .0049
Potential Controller- El Niño/La Niña Cycles • ENSO phase change alters synoptic scale storm motion • Most evident in winter months
Potential Controller- El Niño/La Niña Cycles • MEI + indicate El Niño • Wetter and cooler conditions • MEI – indicate LaNiña • Dryer and warmer conditions
Winter Classic El Nino Events (1982-1983, 1991-1992, 1997-1998, 2002-2003, 2009-2010) (1.1,51%) (1.2,45%) (1.2,42%) (2.5,38%) (1.6,35%)
Winter Classic La Niña Events(1989-1990,1999-2000, 2000-2001, 2010-2012) (-1.12,33%) (-.6,34%) (-1.2,26%) (-.909,22%)
Conclusions and Continued Research • Variation is evident spatially and temporally • Visually, aspect may be a potential controller • Extreme ENSO Phases could be a potential controller • Use SWAT model to cross reference high flood risk areas • Look into other large scale circulations(North Atlantic Oscillation, Artic Oscillation)