Download
1 / 24
240 likes | 249 Views
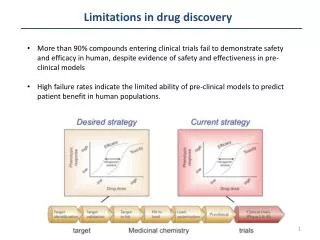
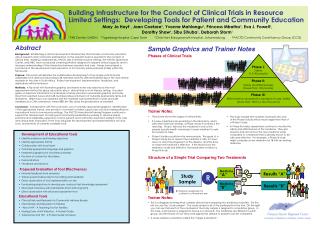
Learn about a successful project aiming to reduce blood culture contamination rates at a hospital, its impact on patient care, and cost savings achieved. Explore the interventions, implementation strategies, and future expansion plans for quality improvement.

E N D
Clinical Safety & EffectivenessSession # 11 Blood Culture Contamination 10/15/2009 Educating for Quality Improvement & Patient Safety
The Team • Nancy Ray RN, MA. Chief Nursing Officer/Associate Administrator. CS&E Participant • Greg Bowling MD. Hospitalist/Assistant Professor. CS&E Participant • Joyce Ornelas RN, Roselle Cabagay RN, Wen Pao RN, Rosette Atienza RN, Leticia Wilson RN, Katherine Cox RN, Esther Hazelwood RN, Carol Monk RN, Jennifer Mapa RN, Deanne Richter RN, Lorisa Gray RN, Liza Paulma RN, Shiji Paulson RN, Cecile Ferrer RN, Renimol Kochumon RN, James Jorgensen PhD, Rosemary Paxson MT(ASCP), Charles Reed RN, 8th floor nursing staff • Facilitator Amruta Parekh MD, MPH
Special Thanks To: • Mentor Luci Leykum MD, MBA, MSc • Wayne Fischer, Ph.D.
What We Are Trying to Accomplish? OUR AIM STATEMENT The aim of our project was to reduce the blood culture contamination rate to less than 2% by August, 2009, on the 8th floor of the University Hospital. We implemented our interventions in May 2009.
Background • Blood Culture contaminants lead to: • Increased length of stay • Delays in procedures • Increased costs of patient care • Unnecessary use of antibiotics (with resultant adverse effects) • Recommended Benchmark for contamination rates is in the range of 2-3%.
Background • In five different patient care areas of our hospital, the average rate of contaminated blood cultures was 6.2% during the time period from 11/2007 to 11/2008. 6
Background Data Mean blood culture contamination rate on 8th floor from 6/2008 to 4/2009 was 4.38%
How Will We Know That a Change is an Improvement? • Types of measures: Number of contaminated blood cultures expressed as a rate. • How we will measure: Data reported from the lab in 2 week intervals. • Specific targets for change: Contamination rate less than 2%.
Selected Process Analysis Tools Fishbone – This helped organize brainstorming sessions to analyze what areas could be improved to decrease the contamination rates of blood cultures. Flowchart – This helped to break down the process to isolate individual points in the process that needed improvement.
What Changes Can We Make That Will Result in an Improvement? • Standardize sterilization of skin with chlorhexidine. • Avoid contamination of sterilized site prior to blood draw. • Prep Blood Culture bottle tops with alcohol swabs. • Sterilize claves with chlorhexidine, switch claves on central lines. • Avoid use of peripheral IV lines for blood culture draws. • Use standardized kits that have all supplies ready for the nurses along with the instruction sheet. • Feedback to nurses regarding their contaminated blood cultures.
Intervention Plan • We worked with nurses on the 8th floor of the University Hospital to establish sterile technique and to standardize the process. • We held brainstorm sessions with nursing to develop a viable process using equipment and a model arm.
Implementing the Change Do • Nursing champions carried out training sessions with a check-list using an arm and a sample kit. They started this in May ‘09. This involved the education of 55 nurses on both day and night shifts. • Nursing developed a kit that stream-lined their process so all of the supplies were readily available.
So… What happened between the beginning of August until now? • Is this sustainable or just an example of the Hawthorne effect? • Is it wise to look at more data before presenting at a big conference?
Expansion of Our Implementation Act • We are working to roll out the intervention to other patient care areas. We need the kits to be produced on a larger scale to facilitate this effort. • We are working at expanding availability of the PICC team to 24/7 coverage. • We are working with IT to streamline the work of obtaining data to monitor for sustained improvement. IT will also work to provide individual feedback to nurses regarding contamination rates.
Return on Investment • Decreasing our rate of blood culture contaminants in five patient care areas from 6.2% to 2% could lead to savings of as much as $535,000 to $2.3 million, and save from 535 to 2400 days of unnecessary length of stay. • The estimated increased cost to provide the kits for all blood cultures drawn in these 5 areas would be approximately $50,000.
We have successfully decreased the blood culture contamination rate on 8th floor of UH to an average of 1.9% from the prior average rate of 4.38%. We will need to follow the data over time to ensure that this impact is sustained. The process improvement will be implemented in other patient care areas of University Hospital. The impact of this change can significantly improve the quality and safety of our patient care as well as lead to significant economic savings for our healthcare system. Conclusion/What’s Next
References • Bates, D. W., L. Goldman, and T.H. Lee. 1991. Contaminant blood cultures and resource utilization: the true consequences of false positive results. JAMA 265: 365-369. • Souvenir, D., et al. 1998. Blood cultures positive for coagulase-negative staphylococci: antisepsis, pseudobacteremia, and therapy of patients. J. Clin. Microbiol. 36: 1923-1926. • Weinbaum, F.I. et al. 1997. Doing it right the first time: quality improvement and the contaminant blood culture. J. Clin. Microbiol. 35: 563-565. • Weinstein, M.P. 2003. Blood Culture Contamination: Persisting problems and partial progress. J. Clin. Microbiol. 41:2275-2278 • Hall and Lyman, Updated Review of Blood culture contamination. Clin Microbiol Rev. Vol 19, 2006, pgs 795-797. • Everts et al. Contamination of Catheter-Drawn Blood Cultures. Journal of Clinical Miccrobiology, Vol 39, No 9, Sep 2001, p 3393-3394 • Beekman and Diekema. Determining The Clinical Significance of Coagulase-Negative Staphylococci Isolated From Blood Cultures. Infection Control and Hospital Epidemiology. Vol 26, No 6. June 2005. pg 559-566 • Richter, Beekmann, Diekema, et al. Minimizing the Workup of Blood Culture Contaminants: Implementation and Evaluation of a Laboratory-based Algorithm. Journal of Clinical Microbiology. July 2002 Vol 40 No 7 pg 2437-2444
Thank you! Educating for Quality Improvement & Patient Safety