Download
1 / 16
160 likes | 297 Views
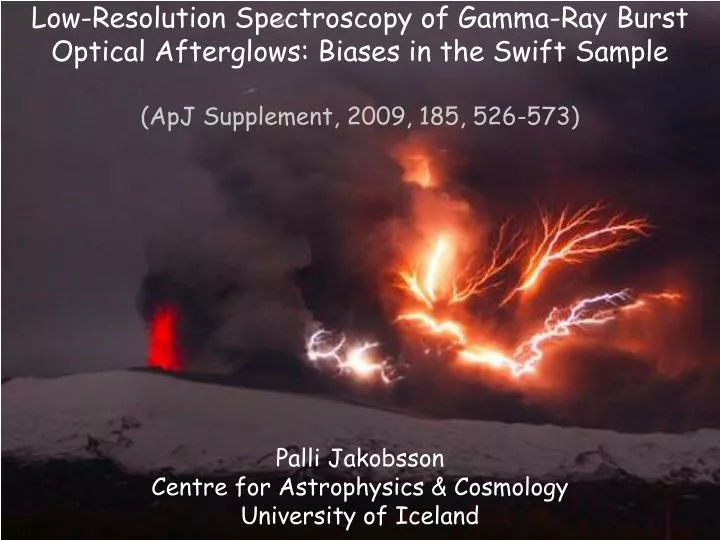
Low-Resolution Spectroscopy of Gamma-Ray Burst Optical Afterglows: Biases in the Swift Sample. ( ApJ Supplement, 2009, 185, 526-573). Palli Jakobsson Centre for Astrophysics & Cosmology University of Iceland.

E N D
Low-Resolution Spectroscopy of Gamma-Ray Burst Optical Afterglows: Biases in the Swift Sample (ApJ Supplement, 2009, 185, 526-573) PalliJakobsson Centre for Astrophysics & Cosmology University of Iceland
Low-Resolution Spectroscopy of Gamma-Ray Burst Optical Afterglows: Biases in the Swift Sample (ApJ Supplement, 2009, 185, 526-573) PalliJakobsson Centre for Astrophysics & Cosmology University of Iceland
The dark burst diagram (βOX) Jakobsson et al. (2004)
Definition of βOX Optical X-ray Sari et al. (1998)
Definition of βOX 2.0 < p < 2.5 Optical X-ray Sari et al. (1998)
The dark burst diagram (βOX) Swift Identification of Dark Gamma-Ray Bursts: Jakobsson et al. (2004)
The sample 1. A Swift-detected GRB with t90 > 2 s. 2. XRT afterglow position distributed within 12 hours. 3. Small foreground Galactic extinction: AV < 0.5 mag. 4. Favorable declination: -70° < δ < 70°. 5. Sun-to-field distance larger than 55°. March 2005 – September 2008: 146 GRBs 75% have an optical/NIR afterglow
The 3 sub-samples 1. GRBs with redshifts measured from OA spectroscopy. 72 • GRBs with detected optical/NIR afterglow, but no • afterglow-based redshift. 35 3. GRBs with no detection of the OA. 39
The dark burst diagram (βOX) [z from OA] 14% [OA but no z] 38% [no OA] >39% 080913 (z = 6.7) 050904 (z = 6.3)
XRT excess absorption distribution KS test probability (1 and 2): 2 x 10⁻³ KS test probability (1 and 3): 7 x 10⁻⁷
βOX vs. X-ray excess absorption dark bursts
Redshift distribution: 146 GRBs Grupe et al. (2007) < 18% @ z > 7 <z> = 2.2