Download
1 / 34
340 likes | 524 Views
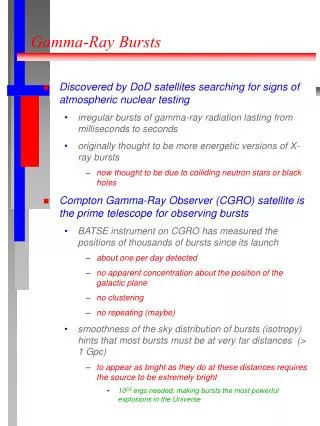
Radio afterglows of Gamma Ray Bursts. Poonam Chandra National Centre for Radio Astrophysics - Tata Institute of Fundamental Research Collaborator: Dale Frail and many others. Radio Afterglows. Late time follow up. Accurate energetics instead of “isotropic equivalent” energy .

E N D
Radio afterglows of Gamma Ray Bursts Poonam Chandra National Centre for Radio Astrophysics - Tata Institute of Fundamental Research Collaborator: Dale Frail and many others
Radio Afterglows • Late time follow up. • Accurate energetics instead of “isotropic equivalent” energy . • Radio scintillation: Constraints on fireball size (Goodman 1997). • Radio VLBI – Fireball expansion. • Reverse Shocks: 6 times more prominent in radio afterglows than optical afterglows. • Density estimation • Detectable at high redshifts.
Radio Afterglows • Late time follow up. • Accurate energy instead of “isotropic equivalent” energy . • Radio scintillation: Constraints on fireball size • Radio VLBI – Fireball expansion. • Reverse Shocks: 6 times more prominent in radio afterglows than optical afterglows. • Density estimation • Detectable at high redshifts.
Negative K-correction(detectable at high redshifts) Chandra et al. 2012, Frail et al. 2006
Radio Afterglows: GRB 970508Frail et al. 2000, 1997, Waxman et al. 1998 • First radio afterglow detection. • Relativistic expansion measurement of fireball through diffractive scintillation. • Measured flux lower than spherical prediction (jet like geometry) • Bright and long lived afterglow followed over a year, E0=5 x 1050 ergs. • Density ~0.5 cm-2, • EquipartitioneB~eE~0.5
GRB radio afterglows • GRB 990123: First afterglow with reverse shock detection in radio band (Kulkarni et al. 1999). • GRB 020405: evidence of a constant density medium around massive star (Berger et al. 2003). • GRB 050904 (Frail et al. 2005) and 090423 (Chandra et al. 2010): highest redshift bursts discovered in radio. • GRB 070125: radio afterglow with scintillation, chromatic break, uniform density (Chandra et al. 2008).
Radio afterglows: 030329van der Horst et al. 2008, Pihlström et al. 2007, Taylor et al. 2004 • Very bright radio burst. • Constant density medium. • Non-relativistic transition ~ 80-200 days • VLBI- relativistic expansion of fireball.
Radio Afterglows: Statistics • 304 GRBs observed in radio bands from 1997-2011. • 123 bursts in pre-Swift and 181 in post-Swift. • Sample includes 33 SHBs, 19 XRFs and 26 SN/GRBs (9 with confirmed SN and rest possible). • 28 SHBs detected by Swift itself. • 17 SN/GRBs detected pre-Swift and 9 post-Swift.
Radio Detection Statistics • 95 out of 304 GRBs detected in radio – 31% • Pre-Swift radio detection 42/123 – 34% • Post-Swift radio detection 53/181 – 29% • X-ray detection rate 42% to 93% (bias). • Optical detection rate 48% to 75% (bias) • No strong redshift dependence • z<2=47/88 z>2=21/43. Chandra et al. 2012, ApJ 746, 156
Detection Statistics Chandra et al. 2012, ApJ 746, 156
Radio Detection Biases Upper limits detection Chandra et al. 2012, ApJ 746, 156
Radio Detection Biases Chandra et al. 2012, ApJ 746, 156
Canonical Light Curve of cosmological long afterglows Chandra et al. 2012, ApJ 746, 156
Bursts of different Classes Chandra et al. 2012, ApJ 746, 156
Detectability of radio afterglows - redshift Kolmogorov-Smirnov test P=0.61 Chandra et al. 2012, ApJ 746, 156
Detectability of radio afterglows - fluence P=2.6x10⁻⁷ • 176/206 (85%) non-detections fluence <1x10⁻⁶ erg cm-2 • 82/95 (86%) detections fluence>1x10⁻⁶ erg cm-2 Nysewander et al. 2009, Swirt XRT repository Chandra et al. 2012, ApJ 746, 156
Detectability of radio afterglows - Energy P=9x10⁻⁷ • k-corrected bolometric in 1 keV-10 MeV range 144 grbs • 60/95 detections Energy >1x1053 erg • Only 9/206 non-detections Energy >1x1053 erg Chandra et al. 2012, ApJ 746, 156
Detectability of radio afterglows - Energy Beaming corrected bolometric energy Where fb is the beaming fraction P=3.5x10⁻³ Chandra et al. 2012, ApJ 746, 156
Detectability of radio afterglows – X-ray and optical P=3x10⁻⁶ P=1x10⁻⁹ Gehrels et al. 2008, de Pasquale et al. 2006, Sakamoto et al.2008, 2011 Chandra et al. 2012, ApJ 746, 156
What determines radio flux? Isotropic Energy R-index=0.12 Fluence R-index=0.02 X-ray flux R-index=-0.05 Optical flux R-index=0.62
Synthetic Light Curveee=0.1 eB=1%, EKE=1053 erg, p=2.2 • 8 GHz light curve matches with sample. • 1.4 GHz challenges: JVLA, ASKAP, WSRT/Apertif will not detect. • Higher frequencies favored. • JVLA (high freq) and ALMA ideal. • Expected large increase in detection. Chandra et al. 2012, ApJ 746, 156
Synthetic Light Curve: densityee=0.1 eB=1%, EKE=1053 erg, p=2.2 • Radio sample biased for n=1-10 cm-3. • Weak emission at lower n. • Higher self-absorption for higher n. • Explains why some bright GRBs dim in radio. Chandra et al. 2012, ApJ 746, 156
Synthetic Light Curve: densityee=0.1 eB=1%, EKE=1053 erg, p=2.2 • Afterglow in mm strong function of n. • Effects of self-absorption weak in mm bands. • ALMA (3-sigma=42 mJy in 1 hr at 250 GHz) may detect all mm afterglows for n>0.1 cm-3. Chandra et al. 2012, ApJ 746, 156
Reverse shocks in radio Kulkarni et al. 1999
Radio Reverse Shocks • Possible RS in 24 GRBs. • But 87 GRBs with no early radio data for t<3 days. • About 1:4 radio AG may be RS
Reverse shocks in radio afterglows • Only 990123 has a confirmed optical and radio reverse shock. • Low incidence of optical reverse shocks, i.e. < 4% (Gomboc et al. 2009). • Radio RS is 1 every 4 bursts, i.e. 6 times more than optical. • Magnetization, poynting dominated, SSC, dust extinction, wind density • Mundellet al. 2007, electron freq drop n~t-73/48. • RS freq is lower by (Lorentz factor)2 than FS. • If nm<nopt then no RS in optcal band • For 021004, 021211 optical RS is seen but no radio RS emission (Synchrotron self absorbtion???)
Future: Atacama Large Millimeter Array Accurate determination of kinetic energy
Summary • Radio afterglows explore unique territory. • Detection rate unchanged in pre- and post-Swift phase. • Radio detections sensitivity limited. • Other prompt and afterglow emission parameters can be useful in determining detectability. • JVLA and ALMA are goldmines