Download
1 / 38
380 likes | 536 Views
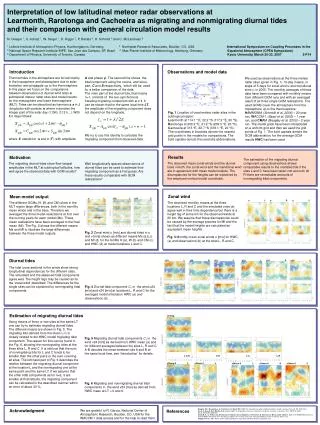
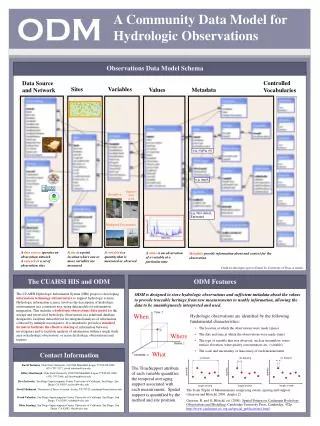
Testing A Community Data Model for Hydrologic Observations. David G Tarboton Jeff Horsburgh David R. Maidment Ilya Zaslavsky David Valentine Blair Jennings. http://www.cuahsi.org/his/tk-observedb.html. Hydrologic Science.

E N D
Testing A Community Data Model for Hydrologic Observations David G Tarboton Jeff Horsburgh David R. Maidment Ilya Zaslavsky David Valentine Blair Jennings http://www.cuahsi.org/his/tk-observedb.html
Hydrologic Science It is as important to represent hydrologic environments precisely with data as it is to represent hydrologic processes with equations Physical laws and principles (Mass, momentum, energy, chemistry) Hydrologic Process Science (Equations, simulation models, prediction) Hydrologic conditions (Fluxes, flows, concentrations) Hydrologic Information Science (Observations, data models, visualization Hydrologic environment (Dynamic earth)
What is a Data Model Lets see what Wikipedia says • A data model is a model that describes in an abstract way how data is represented • Data models describe structured data for storage in data management systems such as relational databases. • Early phases of many software development projects emphasize the design of a conceptual data model.
Continuous Space-Time Model – NetCDF (Unidata) Time, T Coordinate dimensions {X} D Space, L Variable dimensions {Y} Variables, V
Discrete Space-Time Data ModelArcHydro Time, TSDateTime TSValue Space, FeatureID Variables, TSTypeID
Terrain Data Models Grid TIN Contour and flowline
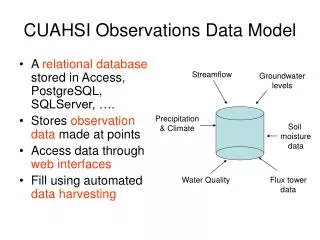
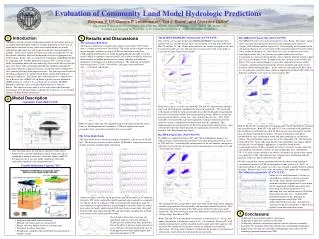
A relational database stored in Access, PostgreSQL, SQL/Server, …. Stores observation data made at points Consistent format for storage of observations from many different sources and of many different types. CUAHSI Point Hydrologic Observations Data Model Streamflow Groundwater levels Precipitation & Climate Soil moisture data Water Quality Flux tower data
Purposes • Hydrologic Observations Data System to Enhance • Retrieval • Integrated Analysis • Multiple Investigators • Standard Format for Sharing • Scalable: Single study area to globe • Ancillary information (metadata) to allow unambiguous interpretation and use • Traceable heritage from raw measurements to usable information
Community Design Requirements(from comments of 22 reviewers) • Incorporate sufficient metadata to identify provenance and give exact definition of data for unambiguous interpretation • Spatial location of measurements • Scale of measurements • Depth/Offset Information • Censored data • Classification of data type to guide appropriate interpretation • Continuous • Indication of gaps • Indicate data quality
Scale issues in the interpretation of data The scale triplet a) Extent b) Spacing c) Support From: Blöschl, G., (1996), Scale and Scaling in Hydrology, Habilitationsschrift, Weiner Mitteilungen Wasser Abwasser Gewasser, Wien, 346 p.
From: Blöschl, G., (1996), Scale and Scaling in Hydrology, Habilitationsschrift, Weiner Mitteilungen Wasser Abwasser Gewasser, Wien, 346 p.
Design Premise • A relational database at the single observation level (atomic model) • Querying capability • Cross dimension retrieval and analysis What are the basic attributes to be associated with each single observation and how can these best be organized?
Feature Hydrologic Observations Data Model MonitoringPoint Waterbody Watershed HydroPoint WaterID HydroCode HydroID HydroID HydroID Name HydroCode HydroCode HydroCode Latitude * FType DrainID FType Longitude Name AreaSqKm … Name AreaSqKm JunctionID JunctionID JunctionID NextDownID * * ComplexEdgeFeature SimpleJunctionFeature CouplingTable WaterID (GUID) HydroID (Integer) HydroEdge HydroJunction HydroJunction HydroJunction 1 HydroID 1 HydroID HydroID HydroID HydroCode HydroCode HydroCode HydroCode ReachCode NextDownID NextDownID NextDownID Name LengthDown LengthDown LengthDown LengthKm HydroNetwork DrainArea DrainArea DrainArea LengthDown FType FType FType FlowDir Enabled Enabled Enabled FType AncillaryRole AncillaryRole AncillaryRole EdgeType Enabled EdgeType Flowline Shoreline Independent of, but coupled to Geographic Representation Arc Hydro HODM 1 1 OR 1 1
Observation Type m3/s L3/T Variable, e.g. discharge Units SampleMedium, e.g. water Valuetype, e.g. field observation, laboratory sample IsRegular, e.g. Yes for regular time series or No for intermittent measurements ObsTimeSupport (averaging interval for observation) TimeUnit (for support) DataType, e.g. Continuous, Instantaneous, Categorical ObservationCategory, e.g. Climate, Water Quality
Data Types • Continuous (Frequent sampling - fine spacing) • Instantaneous (Spot sampling - coarse spacing) • Cumulative • Incremental • Average • Maximum • Minimum • Constant over Interval • Categorical
Stage and Discharge ExampleDischarge Derived from Gage Height
Daily Average Discharge ExampleDaily Average Discharge Derived from 15 Minute Discharge Data
Offset Offset Distance from a datum or control point at which an observation was made OffsetType defines the type of offset, e.g. distance below water level, distance above ground surface, or distance from bank of river
Methods and Samples Method specifies the method whereby an observation is measured, e.g. Streamflow using a V notch weir, TDS using a Hydrolab, sample collected in auto-sampler SampleID is used for observations based on the laboratory analysis of a physical sample and identifies the sample from which the observation was derived. This keys to a unique LabSampleID (e.g. bottle number) and name and description of the analytical method used by a processing lab.
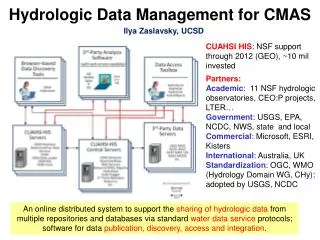
Hydrologic Information System Service Oriented Architecture Web portal Interface (HDAS) Information input, display, query and output services Preliminary data exploration and discovery. See what is available and perform exploratory analyses 3rd party servers Web services interface e.g. USGS, NCDC GIS Matlab Observatory servers IDL SDSC HIS servers Splus, R D2K, I2K Programming (Fortran, C, VB) Downloads Uploads HTML -XML Data access through web services WaterOneFlow Web Services WSDL - SOAP Data storage through web services
Matlab use of CUAHSI Web Services to Query HODM % create HODM Class class createClassFromWsdl('http://water.usu.edu/HODM/hodm.asmx?WSDL'); % This creates an instance of the class. instHODM = HODM; xmlSites=GetSites(instHODM); … xmlSiteInfo=GetSiteInfo(instHODM,SiteCodes(5)); … xmlValues = GetValues(instHODM,SiteCodes(5),VariableCode,D1,D2); … plot(dnt,Qt); datetick; % Get annual maximum series years=min(yeart):max(yeart); for i=1:length(years) qa(i)=max(Qt(find(yeart==years(i)))); end qa=sort(qa); m=length(qa); p=(1:m)/(m+1); plot(qa,p createClass GetSites GetSiteInfo GetValues Analyze Data
Conclusions • A conceptual template for the representation of hydrologic point observations in a relational database • Simple - 16 tables • Queries facilitate flexible data retrieval and analysis involving types, time or space • Standard - a basis for effective sharing • Ancillary information to support unambiguous interpretation of each observation
Accuracy and Precision ObsAccuracyStdDev Numeric value that expresses measurement accuracy as the standard deviation of each specific observation
Observation Series An Observation Series is a set of all the observations of a particular type at one place, i.e. with unique monitoring point (WaterID), observation type, offset and offsettype. The ObservationSeriesCatalog is programatically generated to provide a means by which a user can get simple descriptive information about the variables observed at a location.
Data Quality Data Qualifier Code indicates provides qualifying information about the observations, e.g. Estimated, Provisional, Derived, Holding time for analysis exceeded QualityControlLevel records the level of quality control that the data has been subjected to.- Level 0. Raw Data and Raw Metadata - Level 1. Quality Controlled Data and Associated Metadata - Level 2. Derived Products and Associated Metadata - Level 3. Interpreted Products and Associated Metadata - Level 4. Knowledge Products and Associated Metadata
15 min Precipitation from NCDC Incomplete or Inexact daily total occurring. Value is not a true 24-hour amount. One or more periods are missing and/or an accumulated amount has begun but not ended during the daily period.
Example: Matlab use of CUAHSI Web Services % create NWIS class createClassFromWsdl('http://river.sdsc.edu/NWISTS/nwis.asmx?WSDL'); % This creates an instance of the class. svsNWIS = NWIS; % Specify a SiteID to use SiteID='10109000' % Call the getDischargeValues function to get discharge data. DisVals=getDischargeValues(svsNWIS,SiteID,startDate(1),endDate(1)); % Parse the string that is returned into matrices and plot temp=sscanf(DisVals,'%4d-%2d-%2d,%f'); [n1,n2]=size(temp); ny=n1/4; ind=(1:ny)*4; year=temp((ind-3)); month=temp((ind-2)); day=temp((ind-1)); Q=temp(ind); dn=datenum(year,month,day); plot(dn,Q);datetick;
GetSites % create HODM Class class createClassFromWsdl('http://water.usu.edu/HODM/hodm.asmx?WSDL'); % This creates an instance of the class. instHODM = HODM; xmlSites=GetSites(instHODM);
GetSiteInfo xmlSiteInfo=GetSiteInfo(instHODM,SiteCodes(5));
GetValues xmlValues = GetValues(instHODM,SiteCodes(5),VariableCode,D1,D2);
Matlab Analysis strValues=parse_xml(xmlValues); Nvals=str2num(strValues.child.child(2).value); for i=1:Nvals dn(i)=datenum(cellstr(strValues.child.child(3).child(i).child(1).value)); [year(i),month(i),day(i)]=datevec(dn(i)); Q(i)=str2num(strValues.child.child(3).child(i).child(2).value); End … qa=sort(qa); m=length(qa); p=(1:m)/(m+1); plot(qa,p)