Download
1 / 4
40 likes | 226 Views
Resemblance In Dietary Intakes Between Urban Low-income African American Adolescents and Their Mothers: The HEALTH-KIDS Study. Youfa Wang, MD, PhD: Johns Hopkins University (JHU) Ji Li, MD: JHU Benjamin Caballero, MD, PhD: JHU. JOURNAL OF THE AMERICAN DIETETIC ASSOCIATION.

E N D
Resemblance In Dietary Intakes Between Urban Low-income African American Adolescents and Their Mothers: The HEALTH-KIDS Study Youfa Wang, MD, PhD: Johns Hopkins University (JHU) Ji Li, MD: JHU Benjamin Caballero, MD, PhD: JHU JOURNAL OF THEAMERICAN DIETETICASSOCIATION Wang Y, et al. J Am Diet Assoc. 2009;109 (Jan).
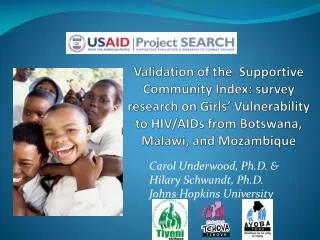
Resemblance In Dietary Intakes Between Urban Low-income African American Adolescents and Their Mothers: The HEALTH-KIDS Study Spearman’s rank correlation coefficients between children’s and their mothers’ dietary intakes by children’s gender and Body Mass Index (BMI) status † Children's BMI status was classified based on the BMI percentiles in the 2000 CDC Growth Chart; ¶ Statistically significant under null hypothesis of r=0, P<0.05; ‡ Marginally statistically significant under null hypothesis of r=0, P<0.10. JOURNAL OF THEAMERICAN DIETETICASSOCIATION Wang Y, et al. J Am Diet Assoc. 2009;109 (Jan).
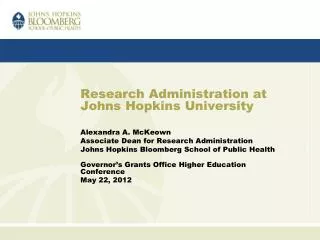
Resemblance In Dietary Intakes Between Urban Low-income African American Adolescents and Their Mothers: The HEALTH-KIDS Study Gender ‡ Children's BMI status ¶ BMI<85th 85th < = BMI<95th BMI >= 95th All Boys Girls percentile percentile percentile (n=121) (n=53) (n=68) (n=78) (n=20) (n=23) Sociodemographics 40.6 39.1 41.8 42.6 35.7 38.3 Age in years (mean (SD)) (10.1) (8.8) (10. 8) (11.1) (6.1) (6.9)¶ 35.0 35.9 34.3 33.8 35.0 39.1 Education : high - school or below (%) 43.8 39.6 47.1 38.5 70.0 39.1 Employment status : unemployed (%) 56.4 59.6 53.7 50.0 68.8 65.2 Household annual income <$20,000 (%) 29.8 26.4 32.4 28.2 30.0 34.8 Current smoker (%) Weight status 30.9 32.0 30.0 29.7 32.2 34.3 BMI (mean (SD)) (7.5) (7.5) (7.4) (6.8) (7.1) (9.0)¶ 23.1 18.9 26.5 28.2 5.0 21.7 overweight (25.0?BMI?29.9), % 48.8 60.4 39.7‡ 41.0 75.0 52.2¶ obesity (BMI?30), % Trying to lose weight (%) 50.4 54.7 47.1 46.2 50.0 65.2 Food related behaviors associated with either family meals or snacking 2661.8 2520.5 2771.9 2604.9 3039.7 2526.0 Energy (kcal) (1746.5) (1747.7) (1750.6) (1555.5) (2364.7) (1783.1) 30.8 29.7 31.6 ‡ 30.7 30.2 31.3 % energy f rom fat (5.1) (4.6) (5.3) (5.3) (3.7) (5.4) 2.2 2.5 2.0 2.8 1.1 1.2 Meals eaten out per week (mean (SD)) (3.3) (3.7) (3.0) (3.9) (1.1) (1.2) ¶ 21.5 28.3 16.2 12.8 40.0 34.8 ¶ Allowing child eating snacks without permission (?often , %) Allowing child purchasing snacks without parent being 14.1 18.9 10.3 12.8 25.0 8.7 present (?often , %) Demographic and eating characteristics of African-American mothers by their children's gender and Body Mass Index (BMI) status: % or mean (SD) ‡ Gender-difference was significant, p<0.05. ¶ Difference across BMI status groups was significant, p<0.05. JOURNAL OF THEAMERICAN DIETETICASSOCIATION Wang Y, et al. J Am Diet Assoc. 2009;109 (Jan).
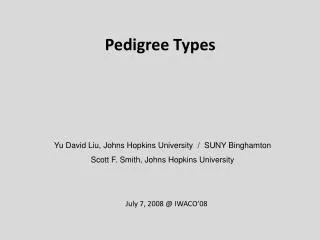
Resemblance In Dietary Intakes Between Urban Low-income African American Adolescents and Their Mothers: The HEALTH-KIDS Study Predictors of dietary intake resemblance between low-SESa African-American adolescents and their mothers (OR, 95%CI): logistic regression models • ¶ OR 95% CI did not include 1.0, p<0.05; ‡ Marginally significant, p<0.10. • SES = Socio Economic Status JOURNAL OF THEAMERICAN DIETETICASSOCIATION Wang Y, et al. J Am Diet Assoc. 2009;109 (Jan).