Download
1 / 10
100 likes | 168 Views
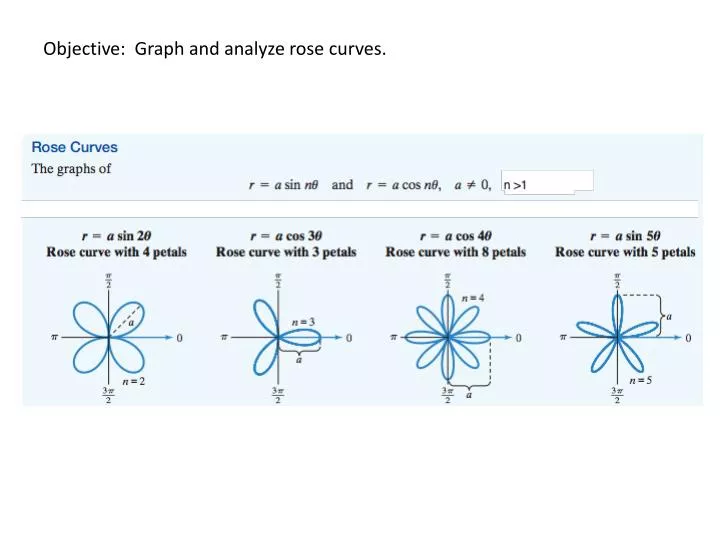
Objective: Graph and analyze rose curves. Objective: Graph and analyze rose curves. Exploration: With your grapher in polar mode enter: 1. Set = 0; = 0.13 and graph r on your calculator using the given value for .

E N D
Objective: Graph and analyze rose curves. Exploration: With your grapher in polar mode enter: 1. Set = 0; = 0.13 and graph r on your calculator using the given value for . a. b. c. d. Describe in writing how parts 1 a-d are related to the figure. 3. State the smallest value for so that you can view the complete graph of . 4. How many petals does have?
Repeat same steps for equation: . 1. 2. 3. 4.
Example 1 Analyze the graph of . Domain: Range: Continuity: Symmetry: Max r-value:
Summary: Rose Curves Forms: or ; (integer) Domain: all reals. Range: Continuous Symmetry: n(even), symmetry about x,y-axes and origin. n(odd), , symmetry about x-axis. n(odd), , symmetry about y-axis. Max r value: Number of petals: n if n is odd. 2n if n is even.
Example 2 Graph:
Example 3 Graph:
The graph of the equation is a circle that is symmetric w.r.t. the x-axis . Diameter from (0,0) to (a, 0) The graph of is a circle that is symmetric w.r.t. the y-axis. Diameter from (0, 0) to (a, ) Example 4 Graph: a. b.
Assignment Pg 683 #13,14,25-28.